DynamoDB Capacity Units and Partitioning
DynamoDB Capacity Units and Partitioning
Note: a browser for Windows such as Chrome, Firefox, or Edge must be the latest version; the same goes for Apple Safari on macOS
In this first exercise, you will load data into DynamoDB tables with different write/read capacity values and compare load times between different data sets.
On the first attempt, we load a small data set into the table and quickly save execution time. Next, we load the larger data set into a table to simulate an exception that causes data transmission bottlenecks. Finally, we simulate the backpressure of GSI on a board by creating a table with a high capacity and a GSI with only 1 write capacity unit (WCU).
Also in this exercise, we will use sample Web server access log data, similar to the web server log data generated by Apache.
Before we start the practice, we would like to go over some important knowledge that you need to know regarding DynamoDB No-SQL Database. In DynamoDB, table, item, and attribute are the main components that we often work with. A table is a collection of items, and each item is a collection of attributes.
DynamoDB uses Primary Keys (PKs) to distinguish items in a table from each other, while secondary indexes add flexibility to queries. You can use DynamoDB Stream to capture events leading to changes in the DynamoDB data table.
Primary Key - Primary Key
There are two types of primary keys: Partition key and Partition key + Sort key
Partition key: is a key with only 1 attribute. DynamoDB uses the value of the attribute that is set as the Partition key as input to the hash function. - - - The result of the hash function will help determine the partition where the corresponding item is located.
- Each table has only one partition key, and there are no two identical partition key values in the same table.
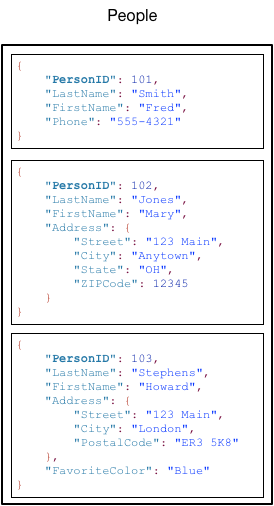
- For example, in the People table, Primary Key has a partition key of PersonID, you can get information on any item as long as you have the PersonID value corresponding to that item. In this case, the Primary key is the Partition key.
Partition key + Sort key: is a combination key of 2 different attributes of a table. The first property acts as the Partition key, and the second property acts as the Sort key.
- DynamoDB still uses the value of the partition key as input to the hash function. The output of the hash function is used to determine the partition containing the corresponding items. At the same time, these items are also stored in the same location and sorted according to the value of the sort key.
- In a table that has both a partition key and a sort key, it is perfectly normal for the values of the partition key to overlap, but these items must have different sort key values to distinguish them from each other…
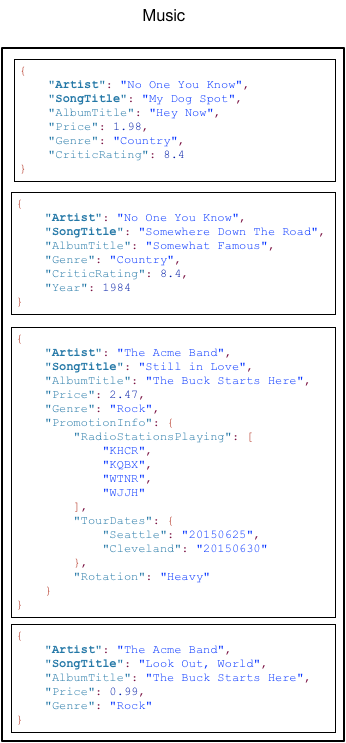
- For example, in the Music table, the Primary key includes the partition key of Artist and the sort key of SongTitle. You can only get the item’s information if and only if you provide 2 Artist and SongTitle information.
- This type of composite Primary Key is often used when we want to add more flexibility to data querying. For example, in case we only want to get the list of songs of a particular Artist, we only need to provide the value of the partition key corresponding to the value of the Artist attribute, along with a range of values of the attribute. calculate SongTitle.
The partition key is also known as the Hash attribute - because the partition key is used as input to the hash function. The Sort key is also known as the Range property - because of the way it stores items with the same partition key value and sorts them based on the sort key value.
- The attribute that is used as the Primary key must have a scalar value. The data types that the Primary Key is allowed to use are string, number, or binary.
Secondary Indexes
-
You can create one or more Secondary Indexes for a DynamoDB table.
-
Secondary Index allows you to query data in a table using surrogate keys, in addition to queries using primary keys.
-
The use of an Index is not required in DynamoDB, but knowing how to use it can give flexibility to data queries.
-
Once the Index table is defined, you can read data from it just like reading on the original DynamoDB table.
-
DynamoDB supports 2 types of Secondary Index which are:
-
Global Secondary Index: Index with Partition key and Sort key value pair must be distinct between data tables
-
Local Secondary Index: The index with the Partition key can be the same on the same table, but the Sort key value must be different
-
Each DynamoDB table is allowed to have 20 GSI (default) and 5 local secondary indexes.
-
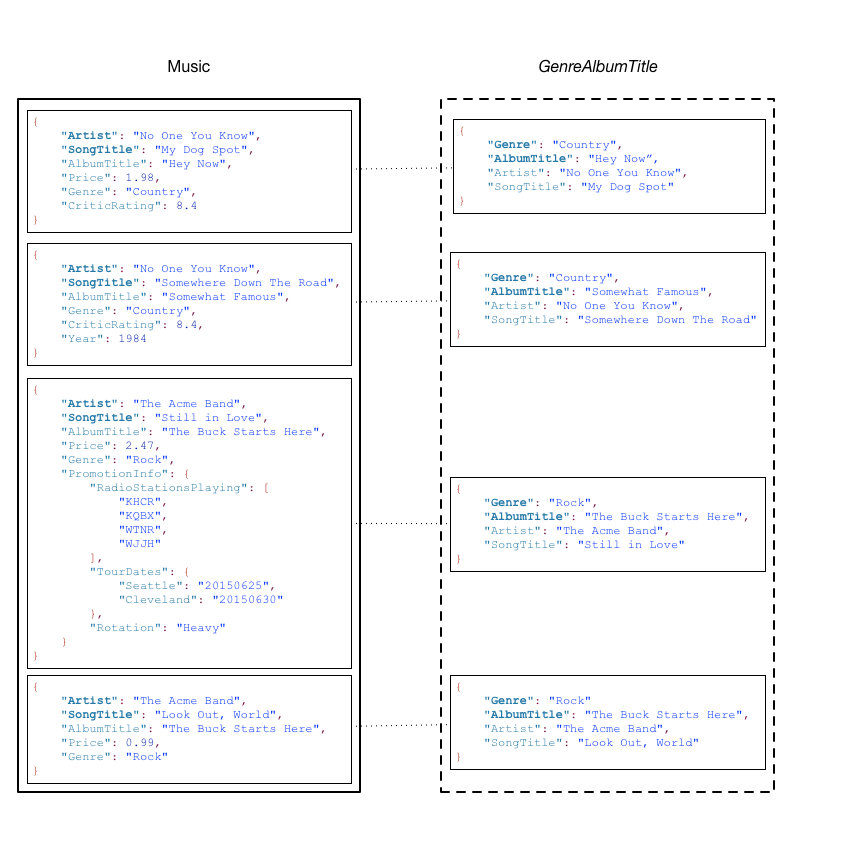
In the Music table example, you can query data with the partition key of Artist or query with the pair (partition key + sort key) as Artist + SongTitle. But what if you want to query the data using the Genre and AlbumTitle properties. To do this, you must create an Index consisting of 2 properties Genre and AlbumTitle, and then query the Index Table as you would on the original Music table.
-
The following diagram shows how an Index Table named GenreAlbumTitle is created. In the Index Table, Genre acts as the Partition key, and AlbumTitle acts as the Sort key.
A few notes on the GenreAlbumTitle Index table:
-
Each GSI Index table belongs to a data table called the Base table. As per the example above, the Music table is the Base table for the GenreAlbumTitle Index table.
-
DynamoDB maintains the Index table automatically. Every time you add, edit, or delete an item from the data table, DynamoDB will automatically add, edit or delete the corresponding item in the Index table of its Base table.
-
When creating an Index, you must specify which properties will be copied, or projected, from the Base table to the Index table. At a minimum, DynamoDB will project the properties acting as Keys from the Base table to the Index table. In the above example, only the properties that act as Keys in the Music table such as Artist (Partition key), SongTitle (Sort key) are projected to the GenreAlbumTitle Index table.
You can query the GenreAlbumTitle Index table to find all albums of a particular genre (eg Rock albums). You can also query to find all albums of a specific genre that have a specific album title (for example, all Country albums with titles starting with the letter H).
DynamoDB Stream
DynamoDB Streams is an optional feature that records a history of data change events in DynamoDB tables. Data about these events is saved to a private data stream in near real time and in the order in which the events occurred. Each event corresponds to a record in the data stream. Once the table has been streamed, DynamoDB Streams will log stream snap information when one of the following events occurs:
-
A new item is added to the table: The stream captures the new item’s content, including its attributes.
-
An item is updated: The stream records the value of the “before” and “after” state item’s attributes change.
-
An item is removed from the table: The stream records the item’s contents before being deleted.
Each record in the stream contains information including the table name, event time, and other metadata. The lifetime of a stream record is 24 hours; then they are automatically removed from the stream.
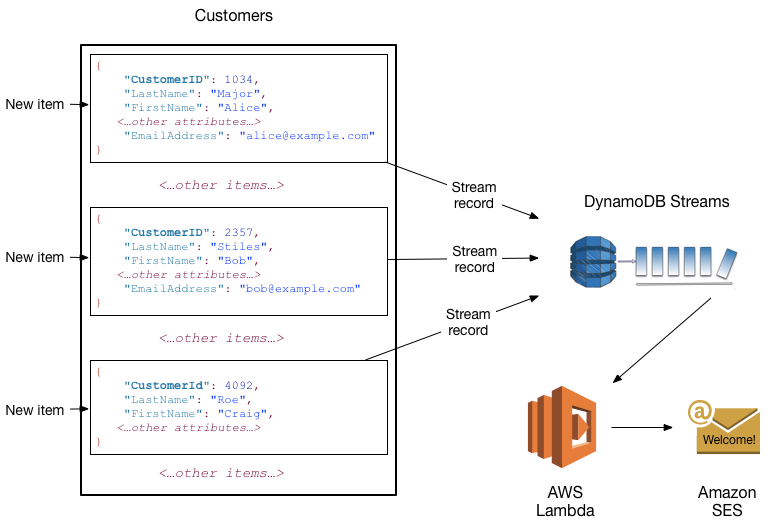
You can use DynamoDB Stream with AWS Lambda to create a trigger—code that runs automatically whenever an event is logged into the stream. For example, consider the Customers table below, the content is customer information of a company. Suppose you want to send a “welcome” email to each new customer, you must first enable the flow on that table, and then associate the stream with a Lambda function. Whenever a new record comes in, new item information is fed into the stream, the Lambda function will process those new items. For any new item with the EmailAddress property, the Lambda function calls the Amazon Simple Email Service (Amazon SES) to send the email.
Next, we will go into the main content of the workshop, which is the practice of applying advanced architecture using DynamoDB.
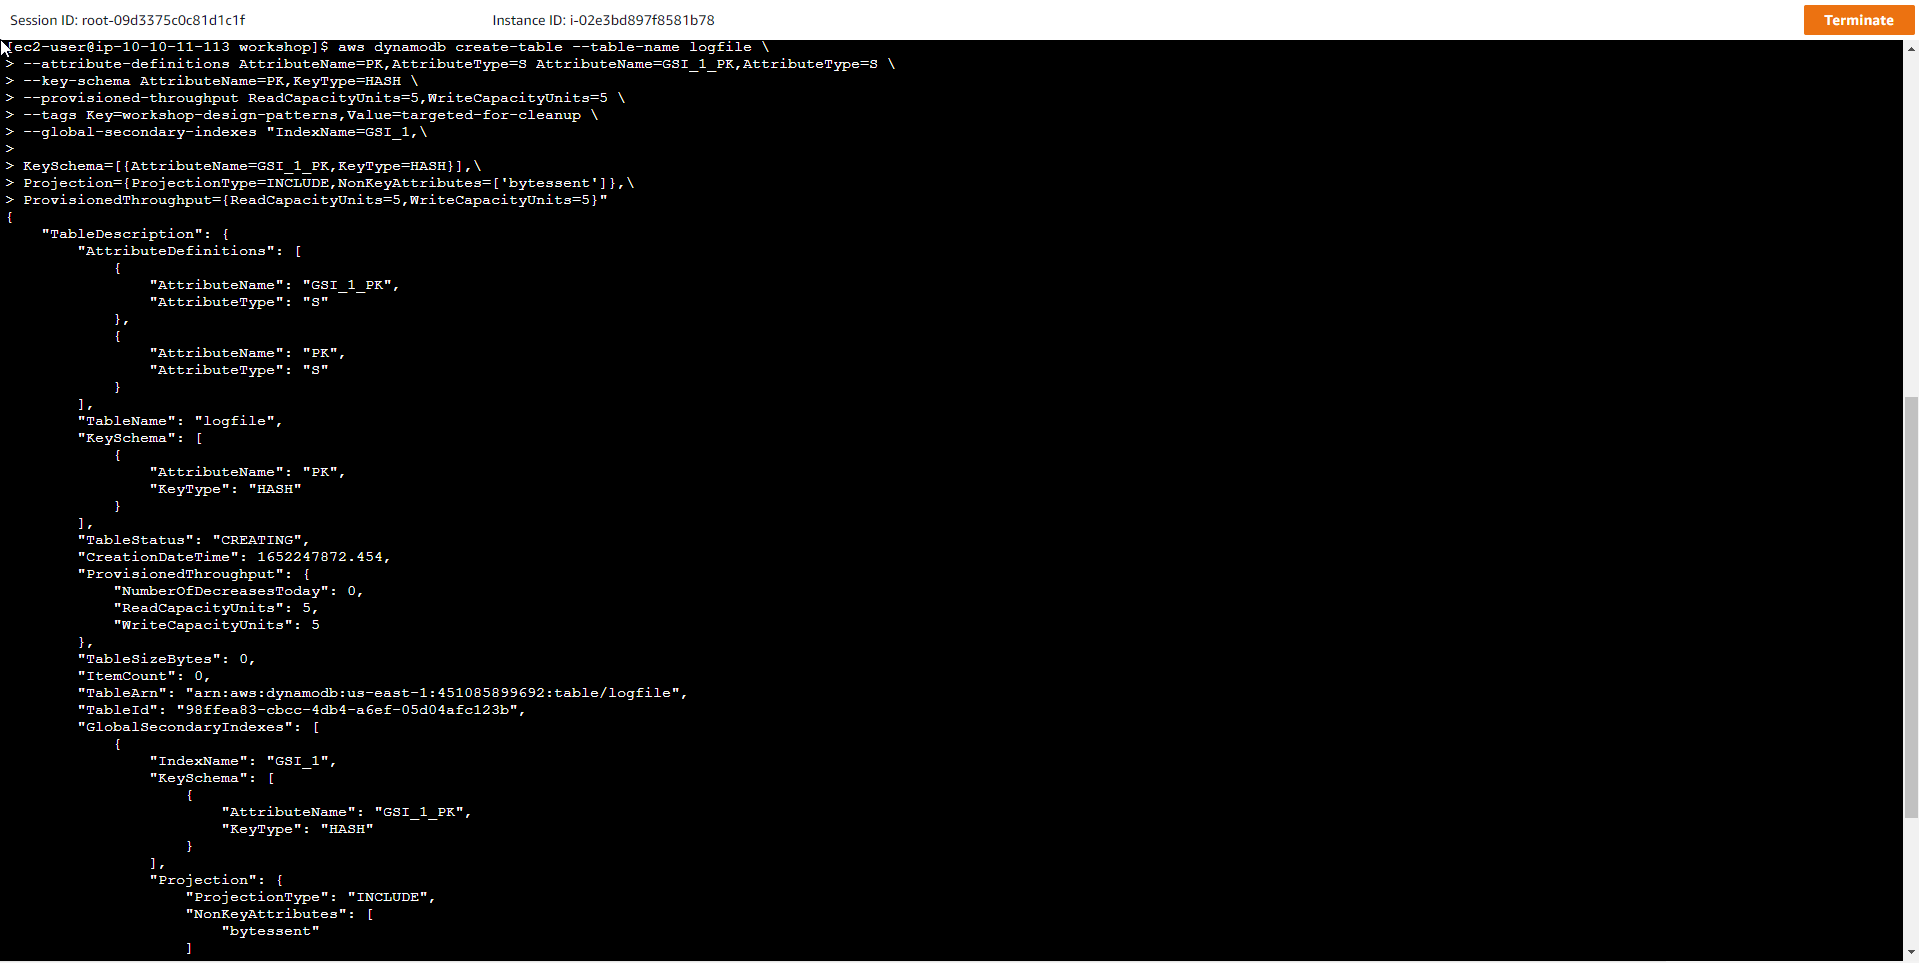
- Initialize the DynamoDB table. Run the command to create a new DynamoDB table named logfile:
aws dynamodb create-table --table-name logfile \
--attribute-definitions AttributeName=PK,AttributeType=S AttributeName=GSI_1_PK,AttributeType=S \
--key-schema AttributeName=PK,KeyType=HASH \
--provisioned-throughput ReadCapacityUnits=5,WriteCapacityUnits=5 \
--tags Key=workshop-design-patterns,Value=targeted-for-cleanup \
--global-secondary-indexes "IndexName=GSI_1,\

KeySchema=[{AttributeName=GSI_1_PK,KeyType=HASH}],\
Projection={ProjectionType=INCLUDE,NonKeyAttributes=['bytessent']},\
ProvisionedThroughput={ReadCapacityUnits=5,WriteCapacityUnits=5}"
The new table structure includes the following components:
-
Key schema: HASH (partition key)
-
Table read capacity units (RCUs) = 5
-
Table write capacity units (WCUs) = 5
-
Global secondary index (GSI): GSI_1 (5 RCUs, 5 WCUs) - Allows querying by IP address of the host machine.
| Tên Thuộc tính (Loại) | Mô tả | Trường hợp Sử dụng | Ví dụ | |
|---|---|---|---|---|
| PK (STRING) | Partition key | Lưu giá trị request id phục vụ công tác kiểm tra nhật kí truy cập | request#104009 | |
| GSI_1_PK (STRING) | GSI 1 partition key | Thông tin về request, một địa chỉ IPv4 | host#66.249.67.3 |
Special Attributes are those that have been set as the Primary Key of the Base table or of the GSI Index table. GSI Index tables also have the same primary keys as its Base table.
In DynamoDB, the partition key is also known as the hash key because the value of the partition key is used as input to the hash function of the DynamoDB table, and the sort key is also known as the range key because this key is used to rearrange a table. set of items with the same partition key value.
Special Attributes are those that have been set as the Primary Key of the Base table or the GSI Index table. GSI Index tables also have the same primary keys as their Base table.
In DynamoDB, the partition key is also known as the hash key because the value of the partition key is used as input to the hash function of the DynamoDB table, and the sort key is also known as the range key because this key is used to rearrange a table. set of items with the same partition key value.
The DynamoDB APIs use the terms hash and range, while the AWS docs use the terms partition and sort. Regardless of the terminology, however, these two keys will together form the Primary key.
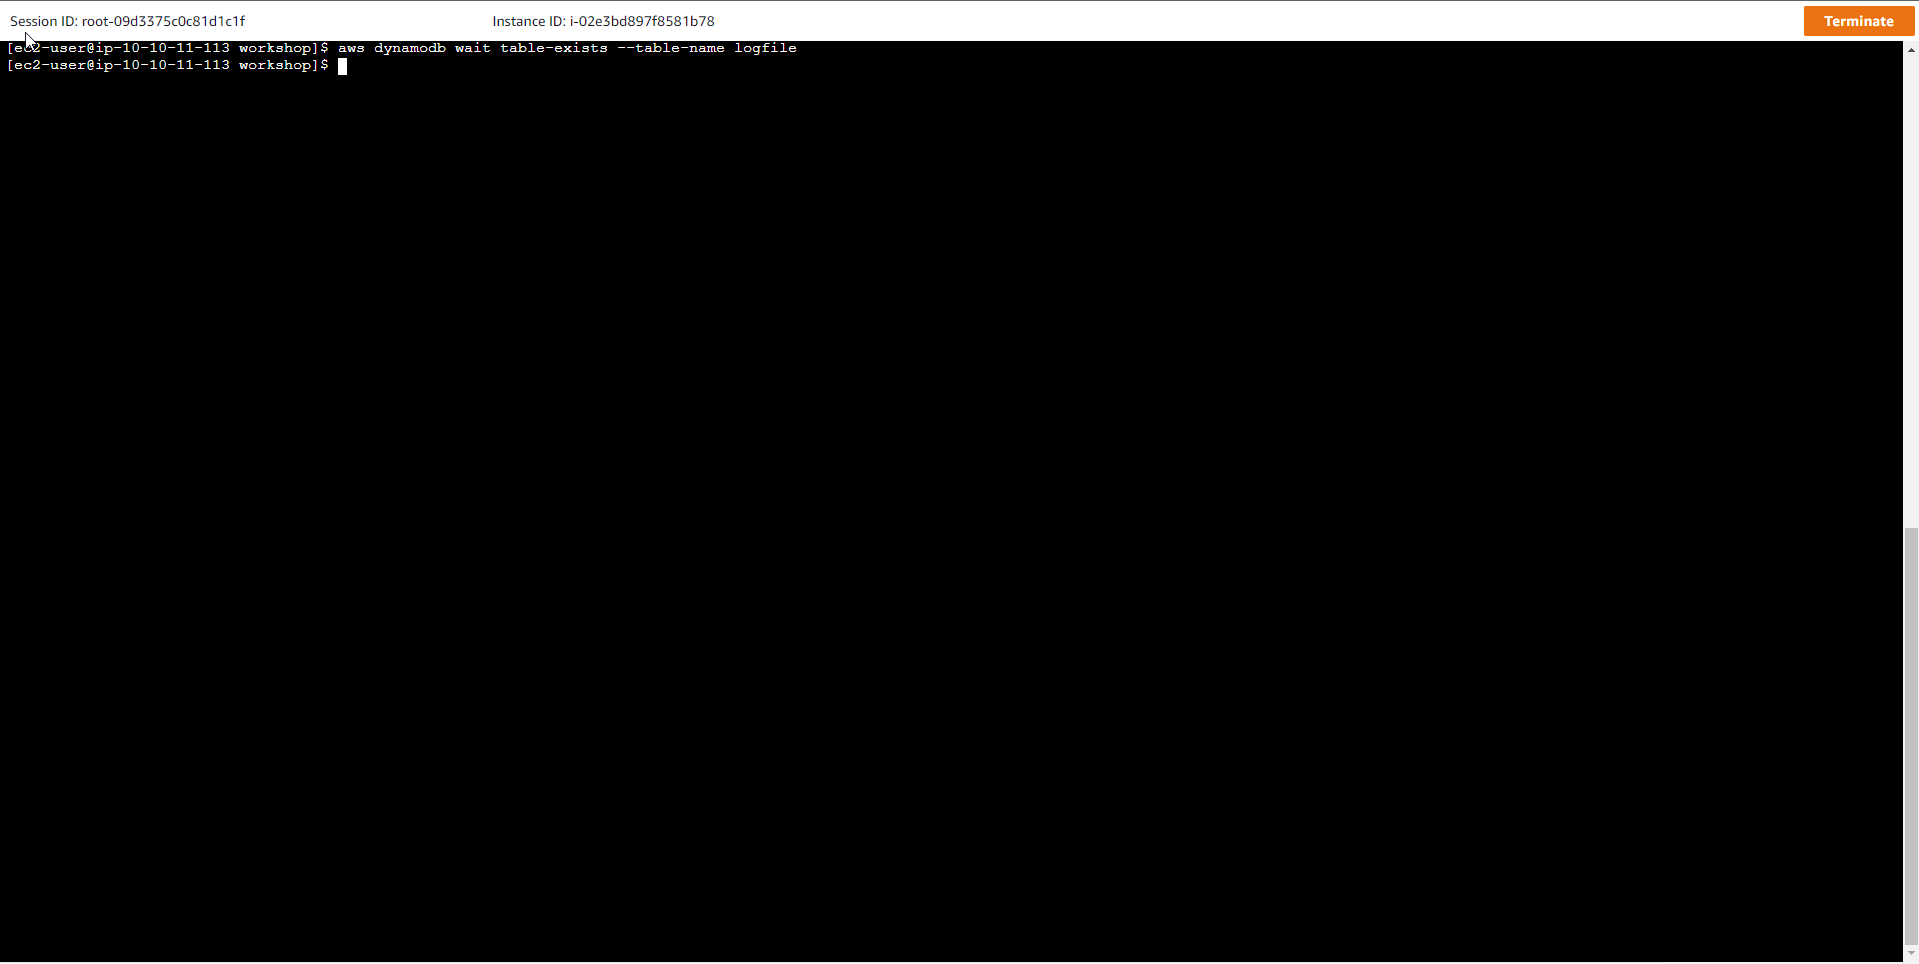
- Run the following command and wait until the state of the table becomes ACTIVE:
aws dynamodb wait table-exists --table-name logfile
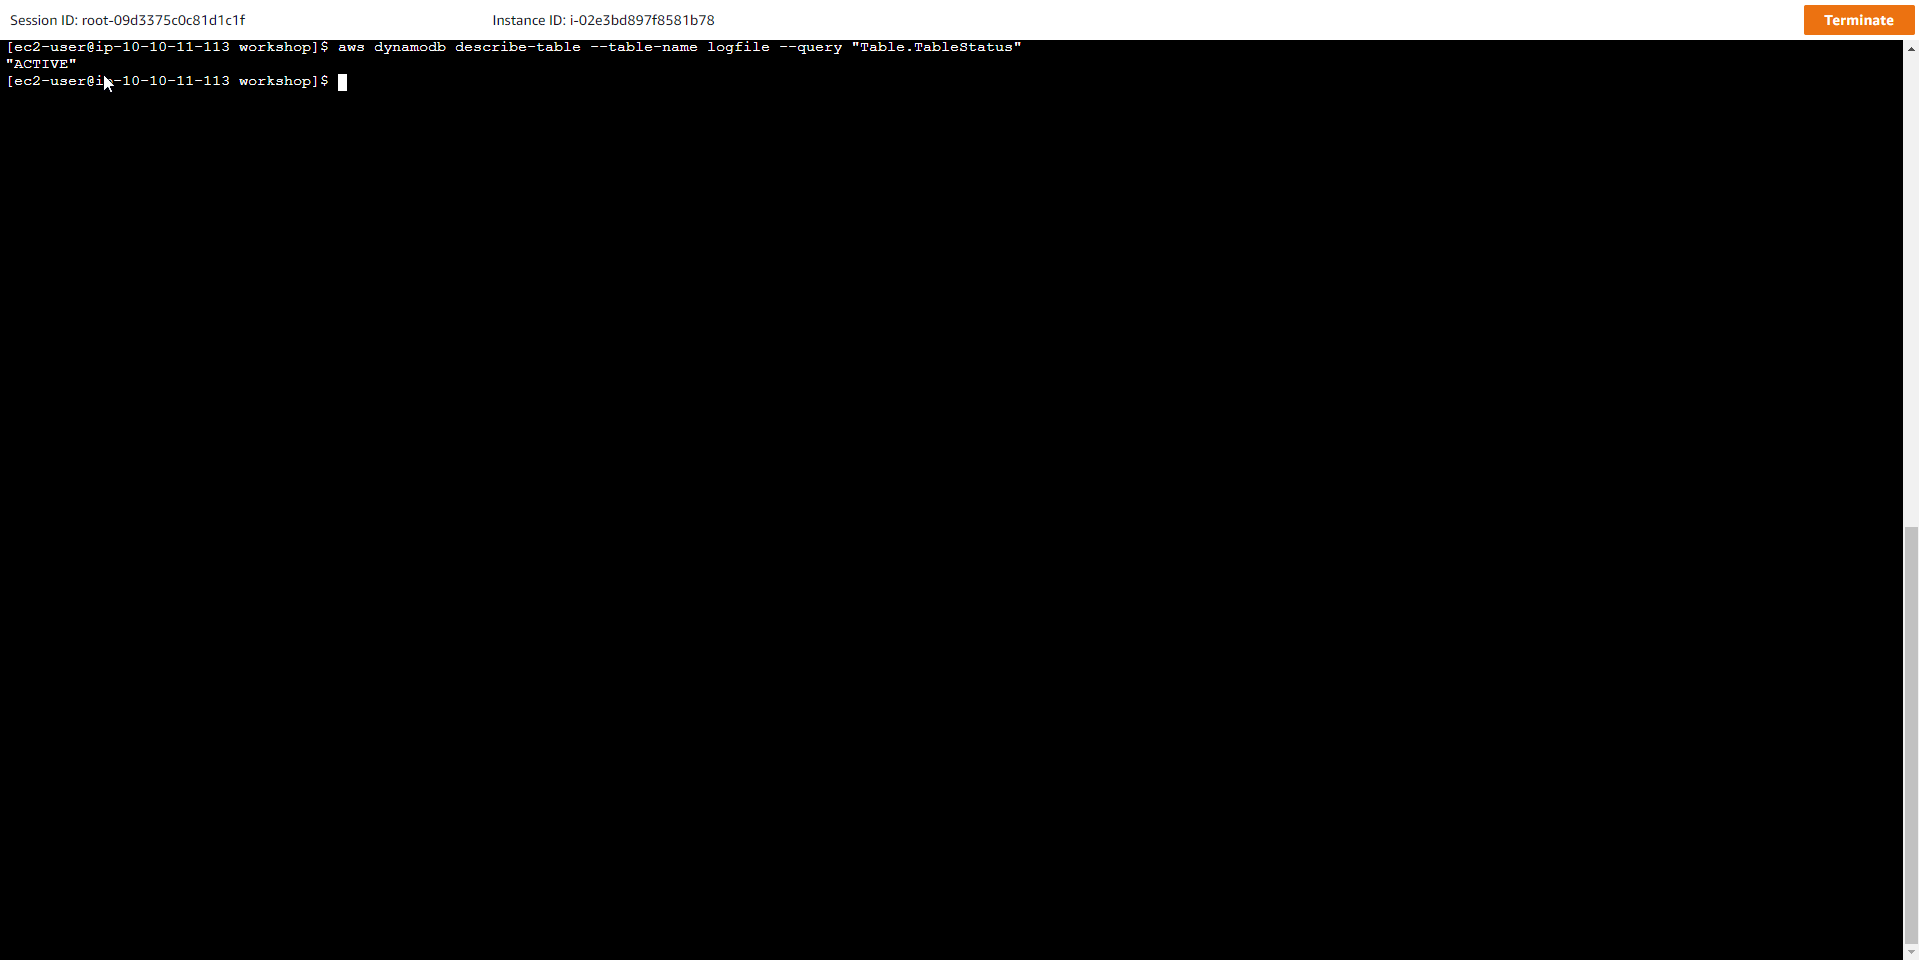
- Or just to check the table state, we use the command:
aws dynamodb describe-table --table-name logfile --query "Table.TableStatus"
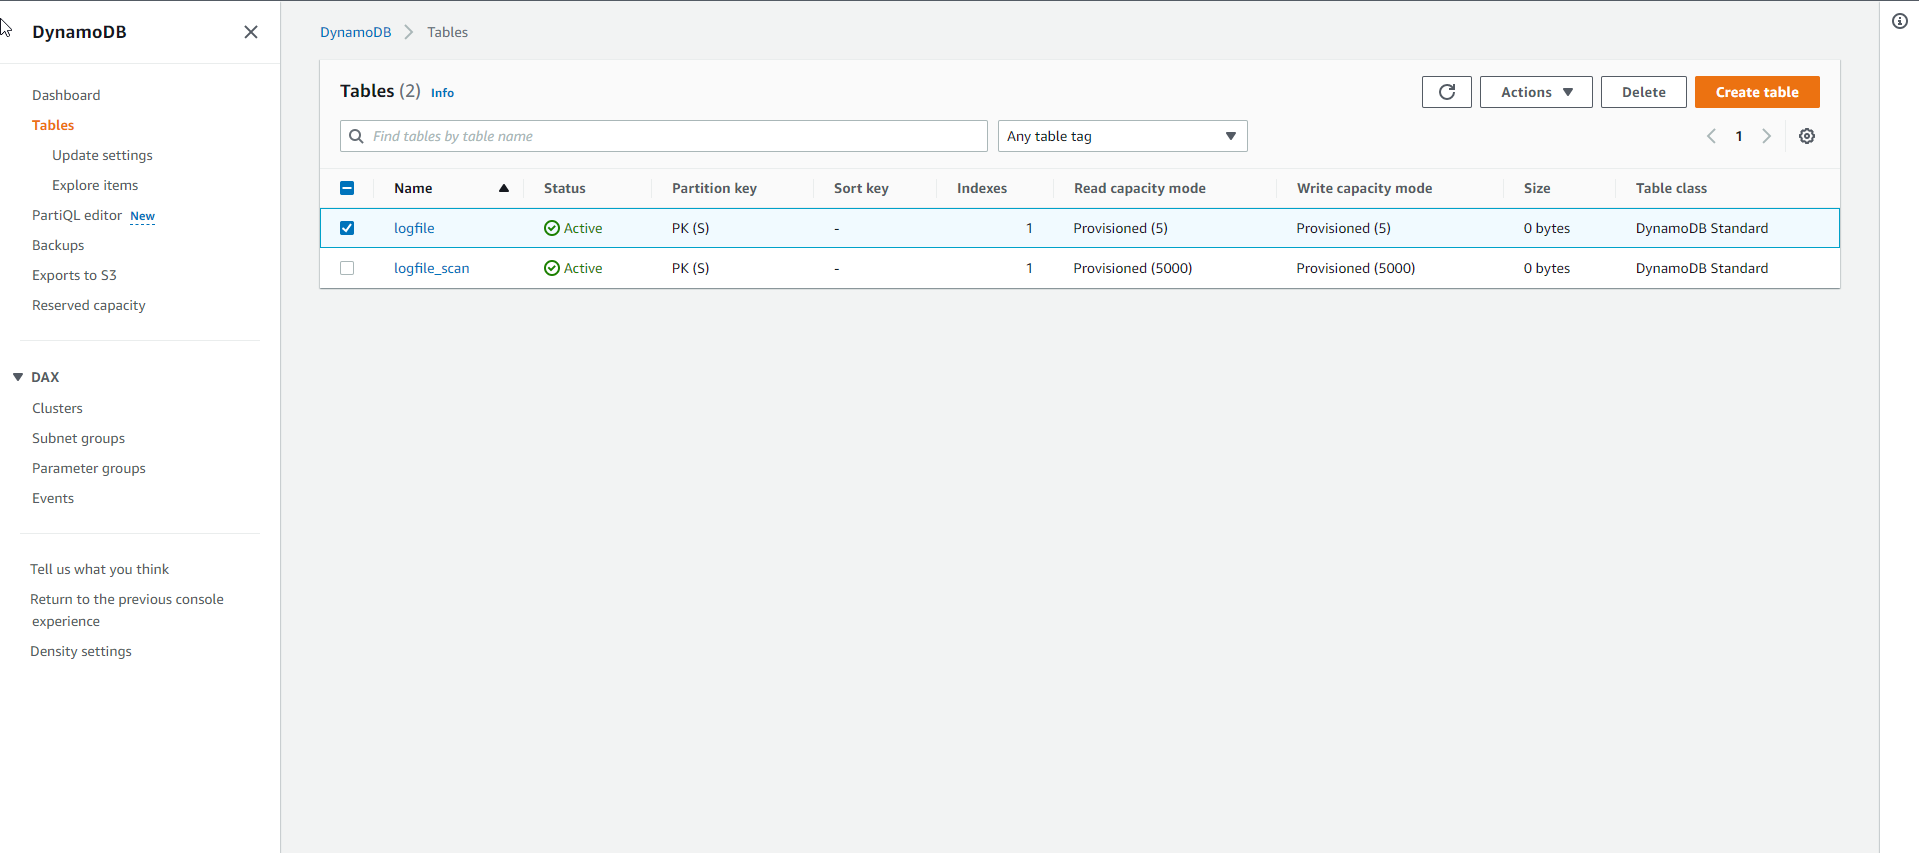
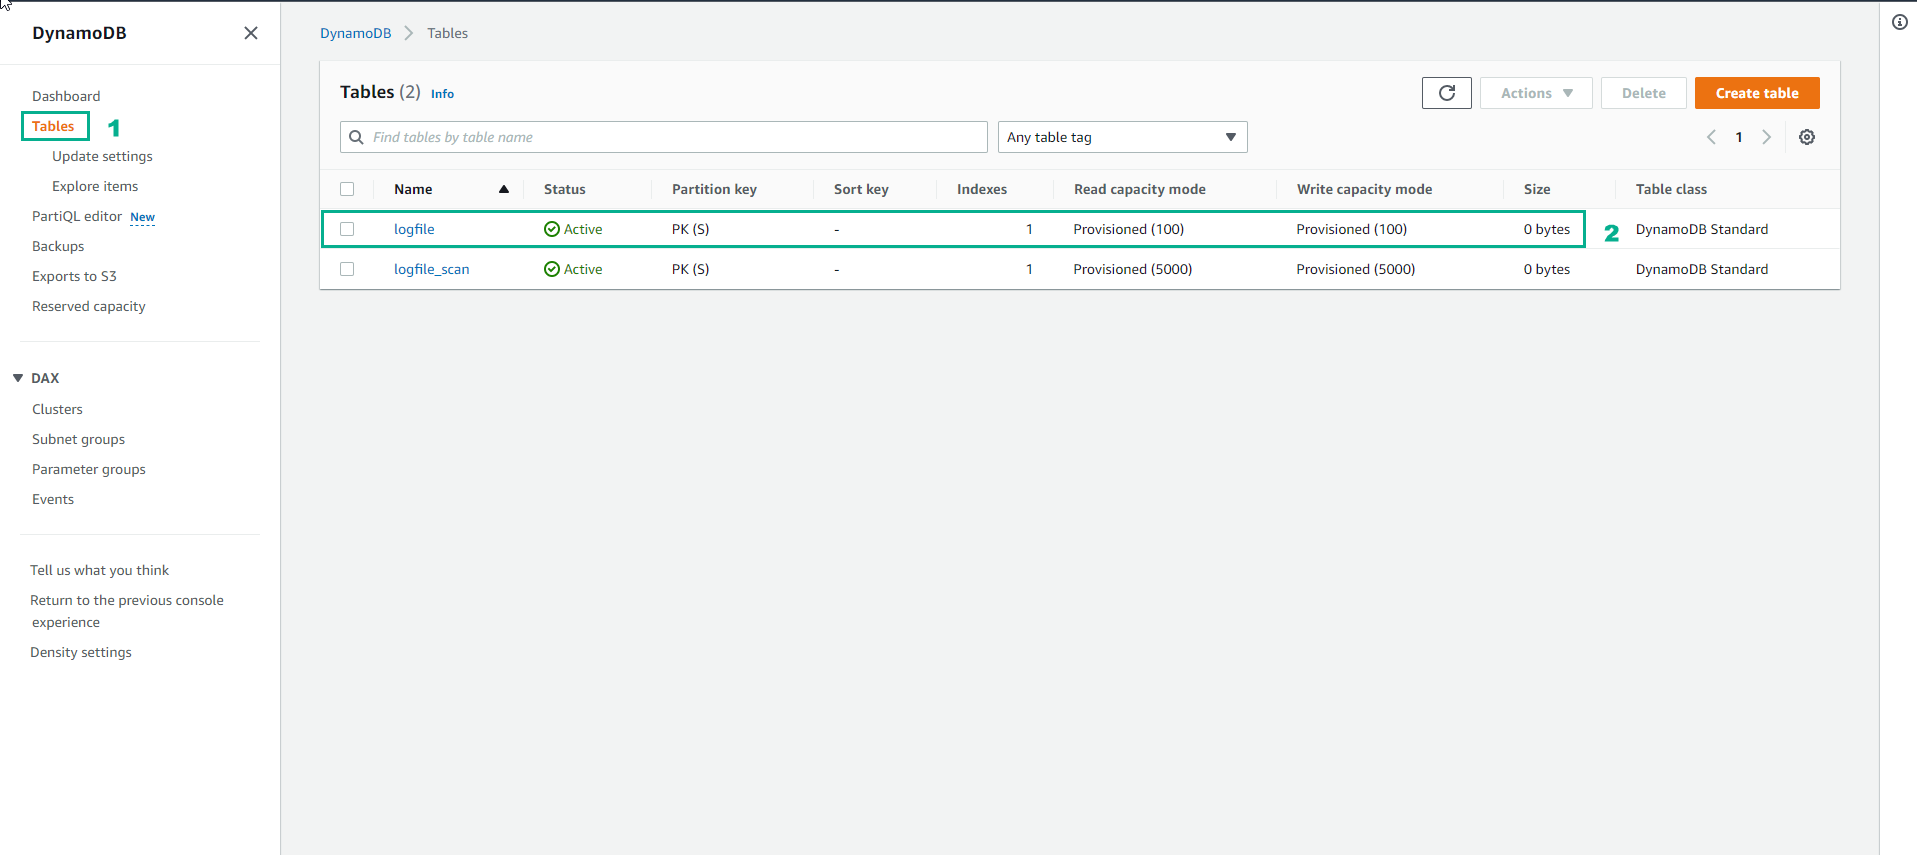
- In the AWS DynamoDB interface
- Select Table
- If the status of the logfile table is Active, the table creation is successful
- Load sample data into the table. After the table has been created, you can load the sample data using the Python script as shown below:
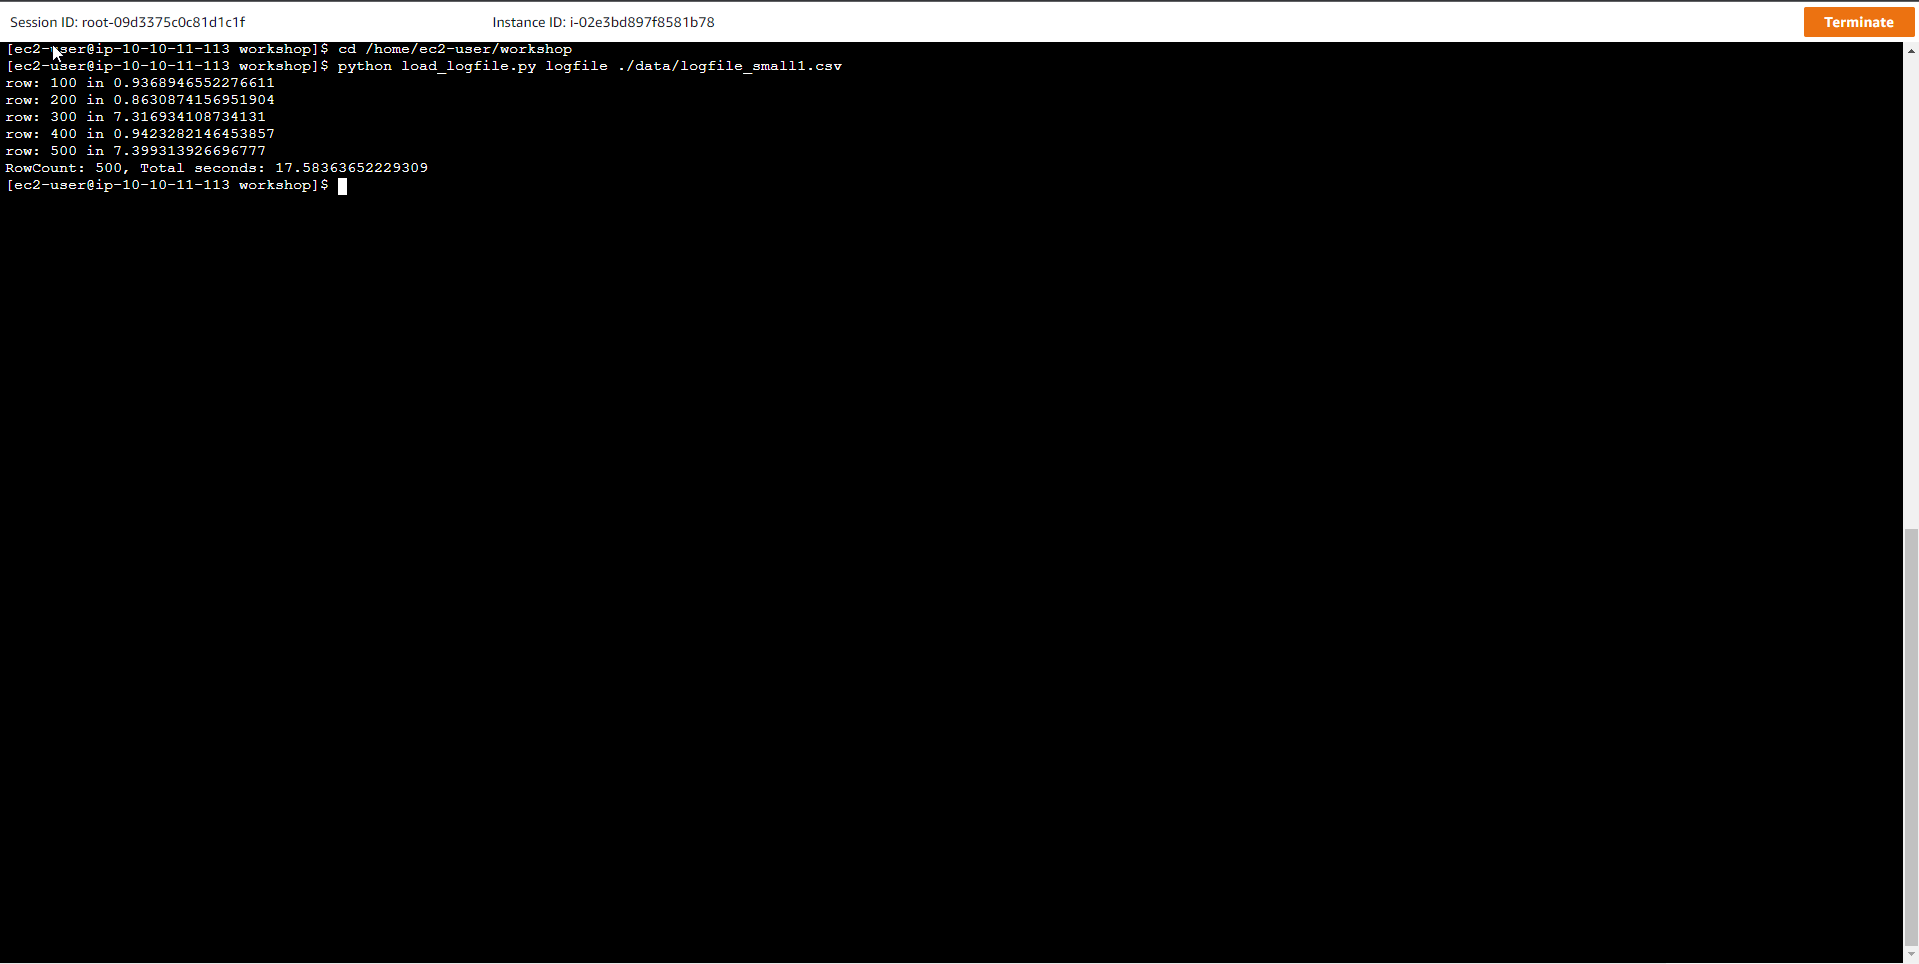
cd /home/ec2-user/workshop
python load_logfile.py logfile ./data/logfile_small1.csv
Where, logfile is the table name, and the sample data is in the file logfile_small1.csv
row: 100 in 0.780548095703125
row: 200 in 7.2669219970703125
row: 300 in 1.547729730606079
row: 400 in 3.9651060104370117
row: 500 in 3.98996901512146
RowCount: 500, Total seconds: 17.614499807357788
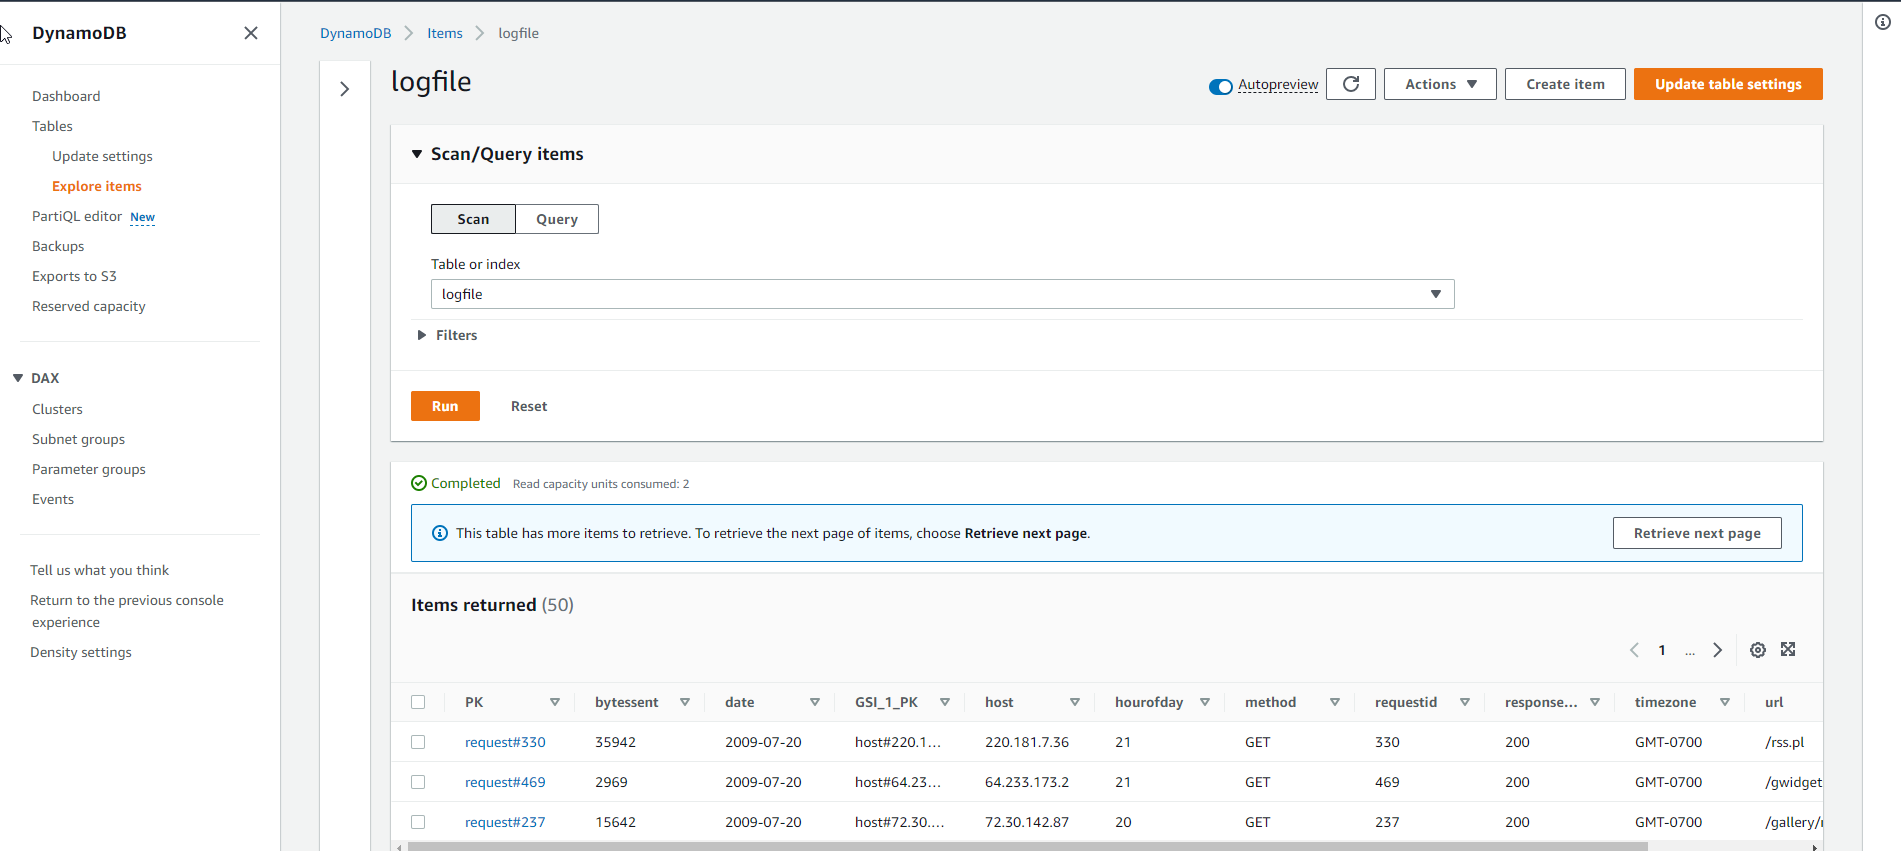
- logfile interface after loading data
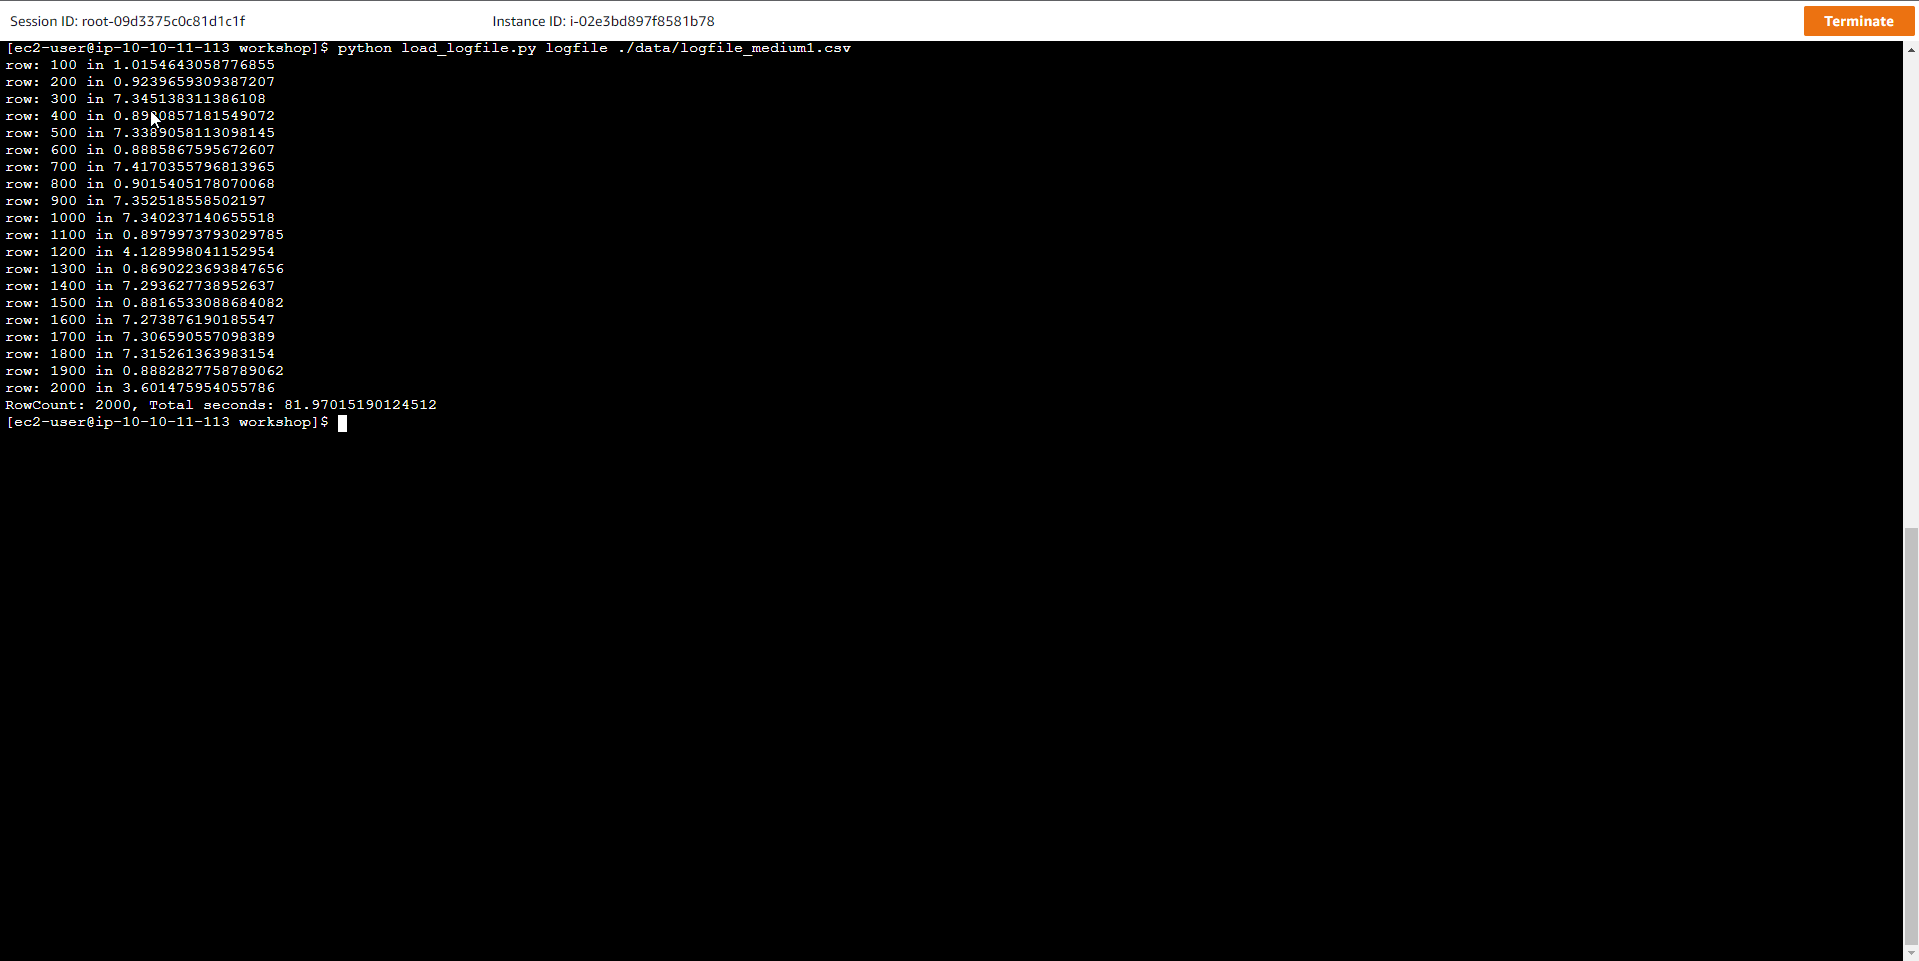
- Load larger sample data into the table. Run the script again, but this time using a larger sample file
python load_logfile.py logfile ./data/logfile_medium1.csv
Where logfile is the name of the table, and logfile_medium1.csv is the name of the sample data file.
The result of the above script is as below, it shows that the data load is getting slower and slower and takes about 1 to 3 minutes to complete
row: 100 in 0.490761995316
...
row: 2000 in 3.188856363296509
RowCount: 2000, Total seconds: 75.0764648914
or
row: 100 in 0.490761995316
...
row: 2000 in 18.479122161865234
RowCount: 2000, Total seconds: 133.84829711914062
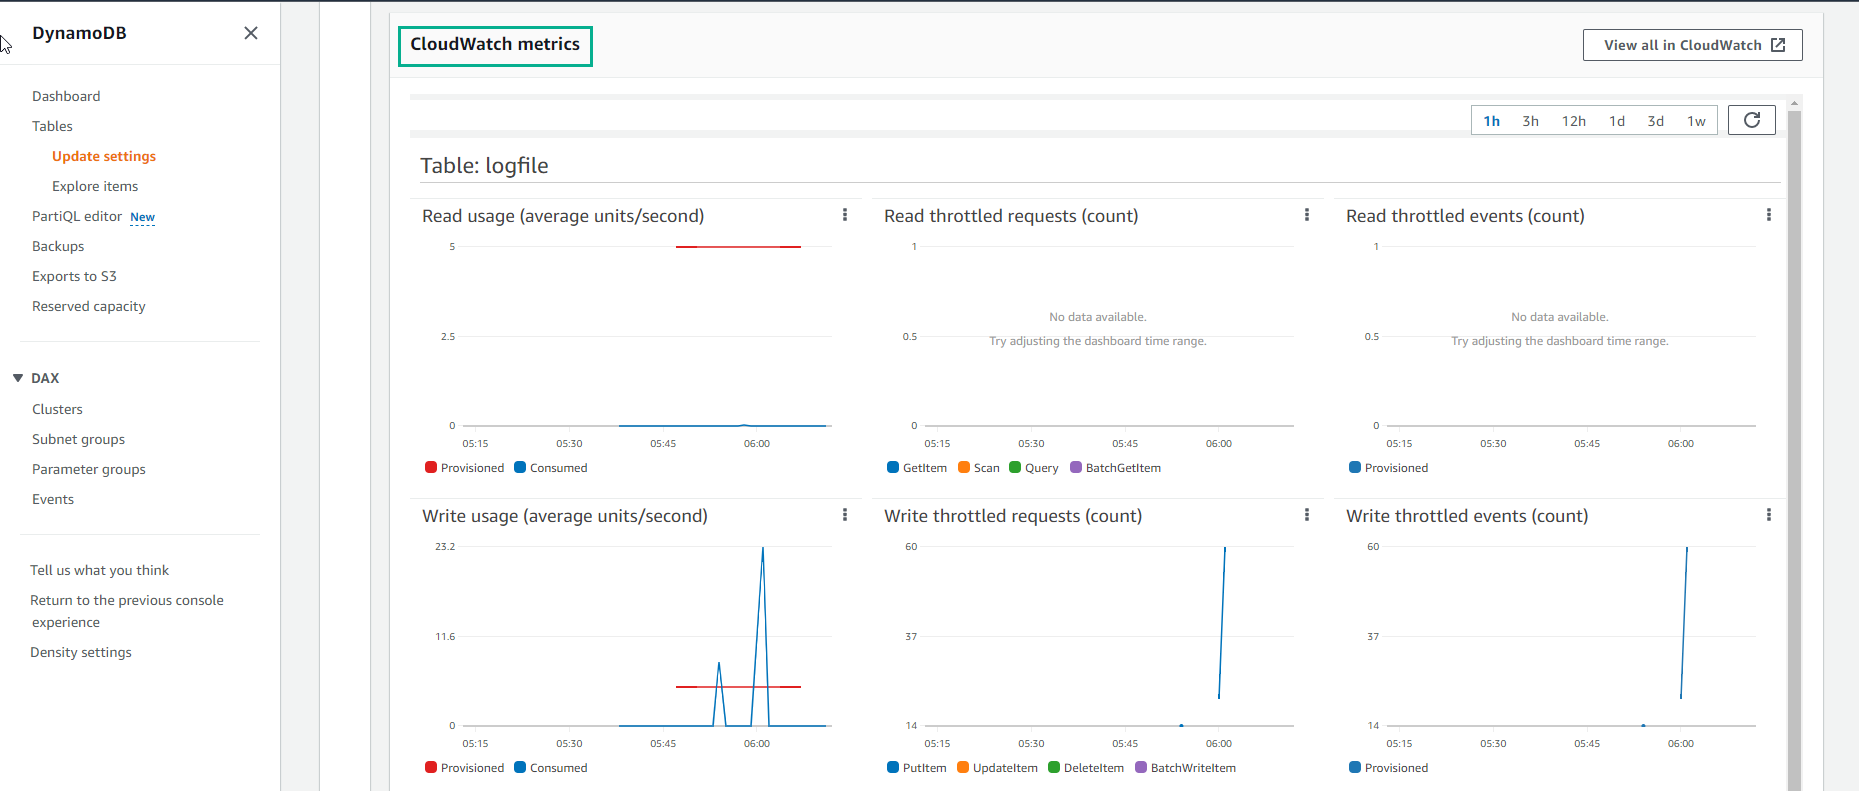
Note that the loading time for each batch of 100 lines (records) is around 5s. When so many batches are written down, bottlenecks occur, causing the Boto3 SDK to slow down the insert speed (or slow down exponentially). At this point, DynamoDB will need more capacity to meet data loading performance. In Amazon CloudWatch, information regarding data feed congestion is represented by a metric named WriteThrottleEvents.
- Check the table’s CloudWatch Metrics.
- Access to DynamoDB
- Select Table
- Select the table logfile
- Select Monitor
- View CloudWatch metrics
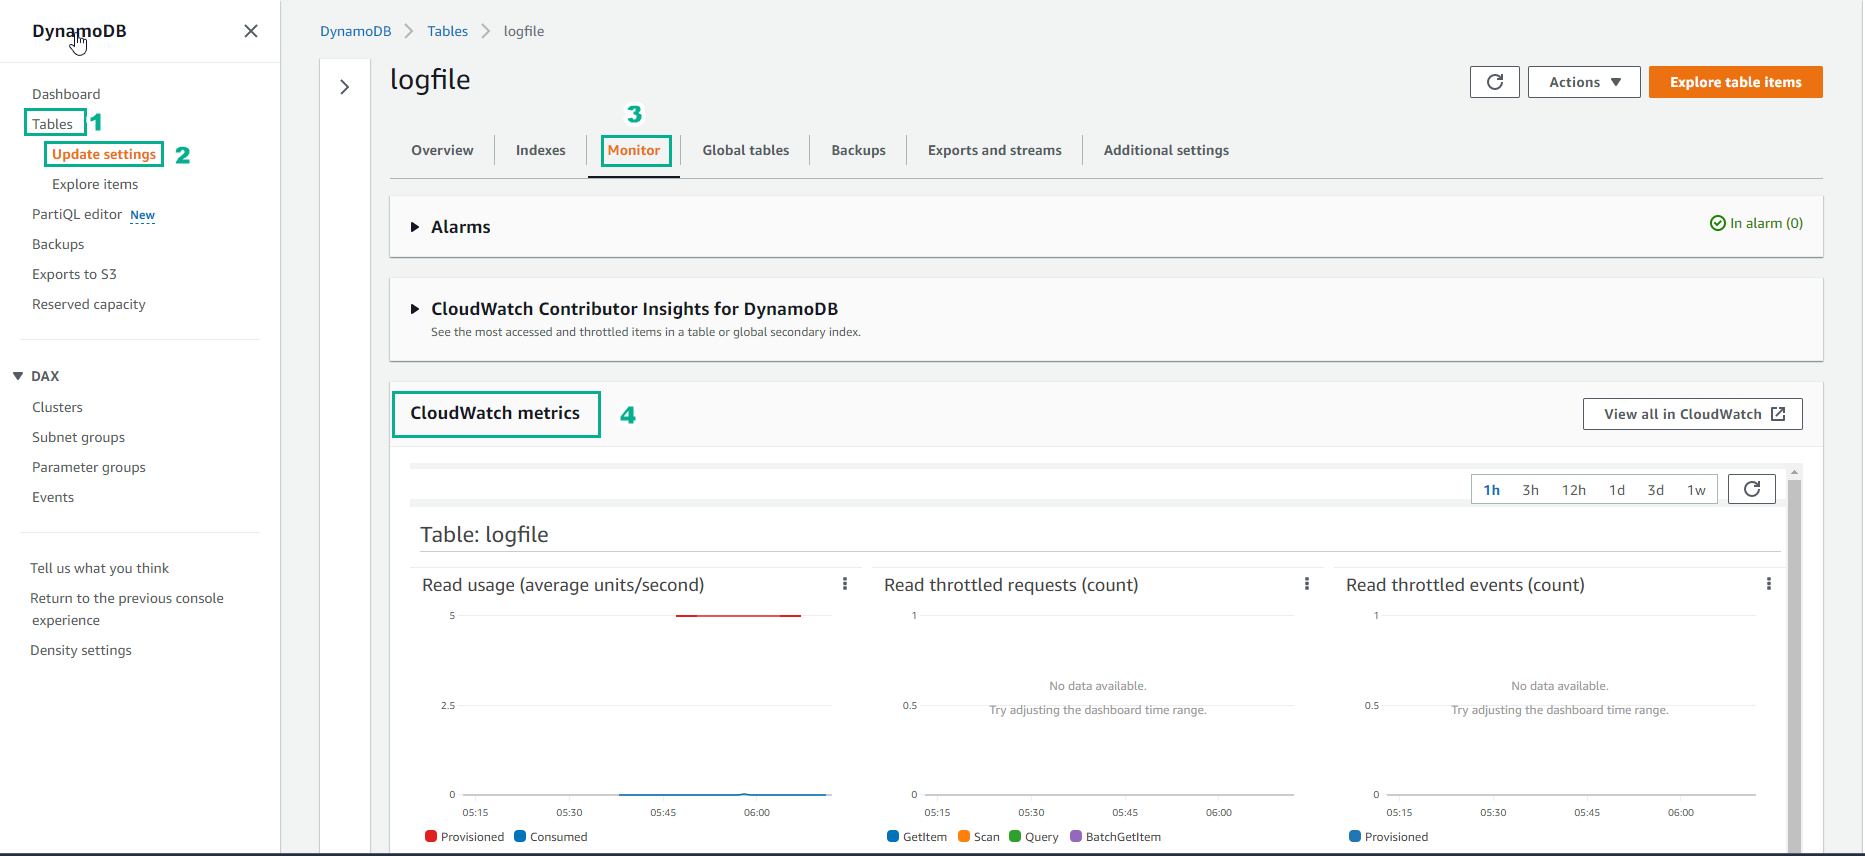
- CloudWatch metric shows information like below
For newly created tables, it will take some time for the read/write data capacity information to be displayed on the graph.
- For the GSI Index table, CloudWatch metric will show like below:
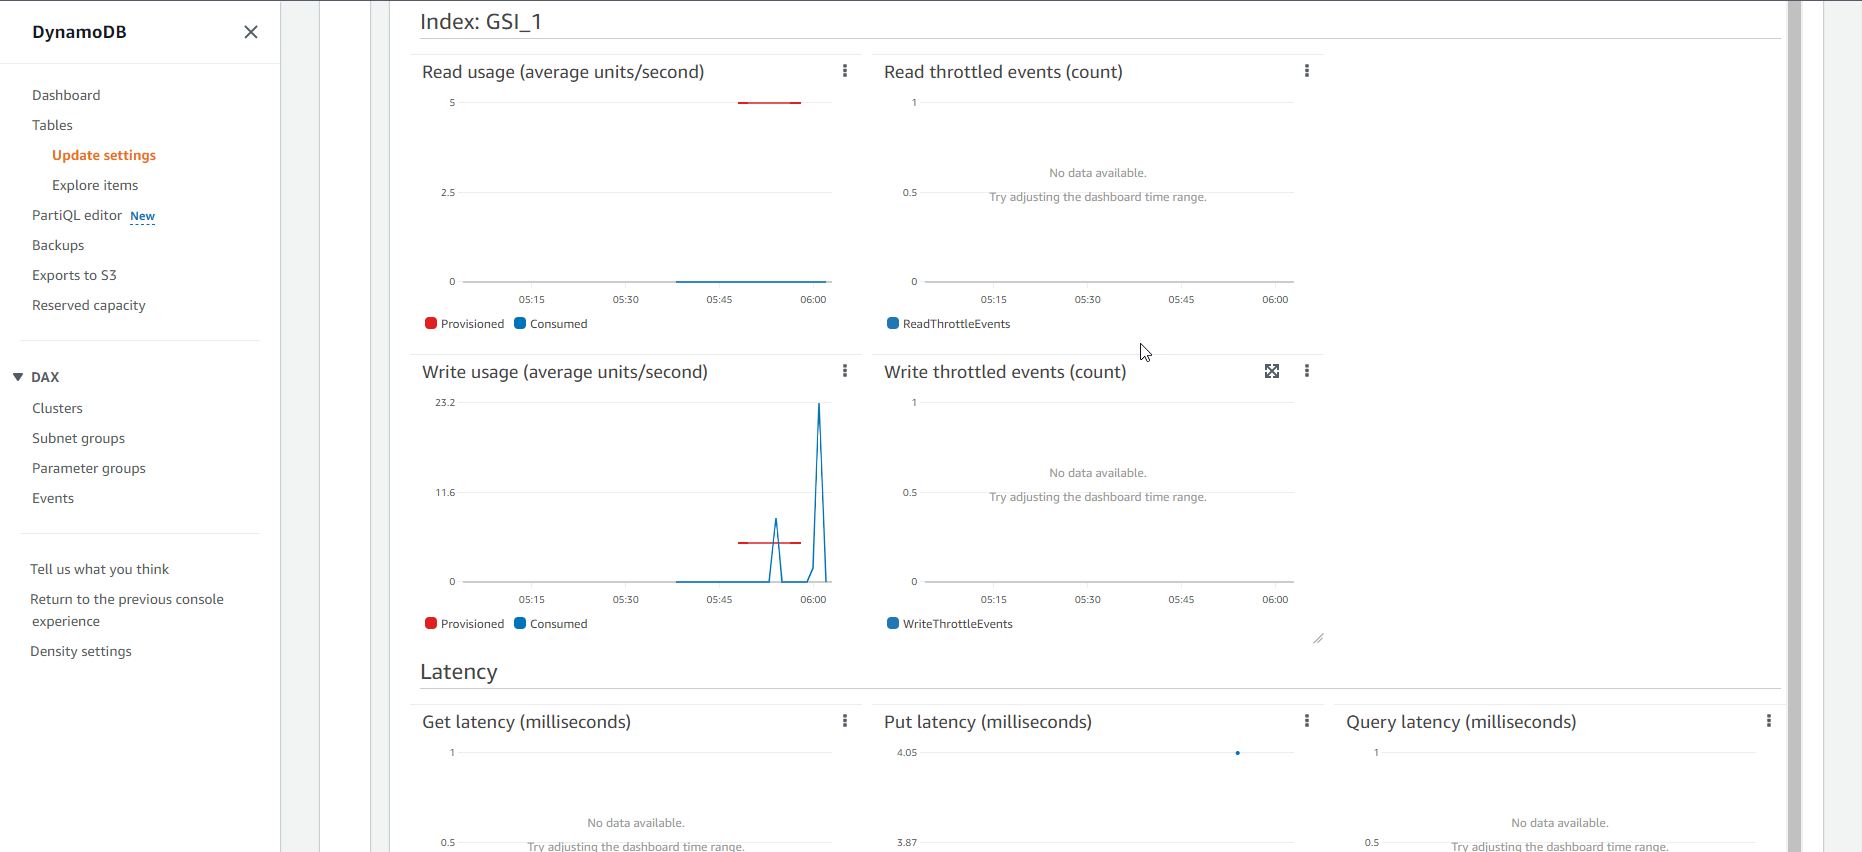
- Maybe some of you wonder, why the event of congestion when loading data does not appear in the metric chart of the GSI table, but only in the graph of the Base table. That is because between the Base table and the Index table, there is always a buffer, only when the capacity of the base table is exhausted for a long time will the congestion event appear on the chart of the Index table.
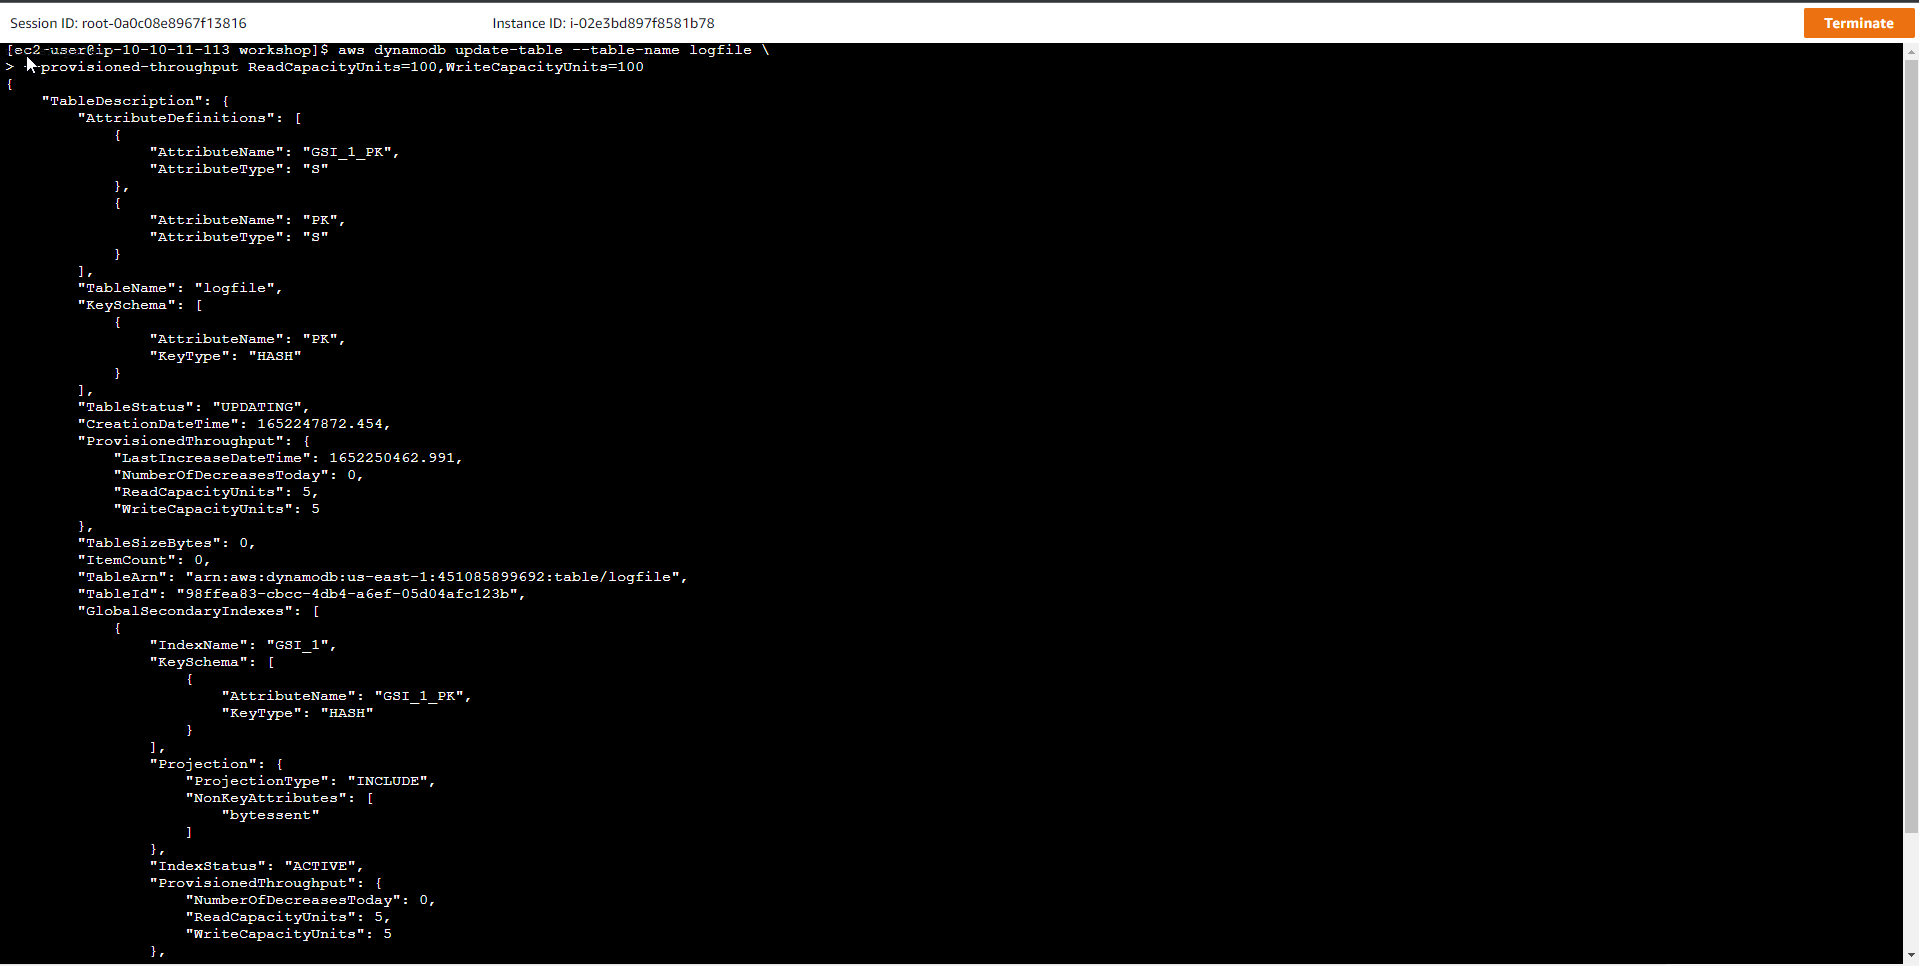
- Increase the Capacity of the table. Run command to increase capacity from 5 to 100
aws dynamodb update-table --table-name logfile \
--provisioned-throughput ReadCapacityUnits=100,WriteCapacityUnits=100
- Run a pending command until the table state becomes ACTIVE
time aws dynamodb wait table-exists --table-name logfile
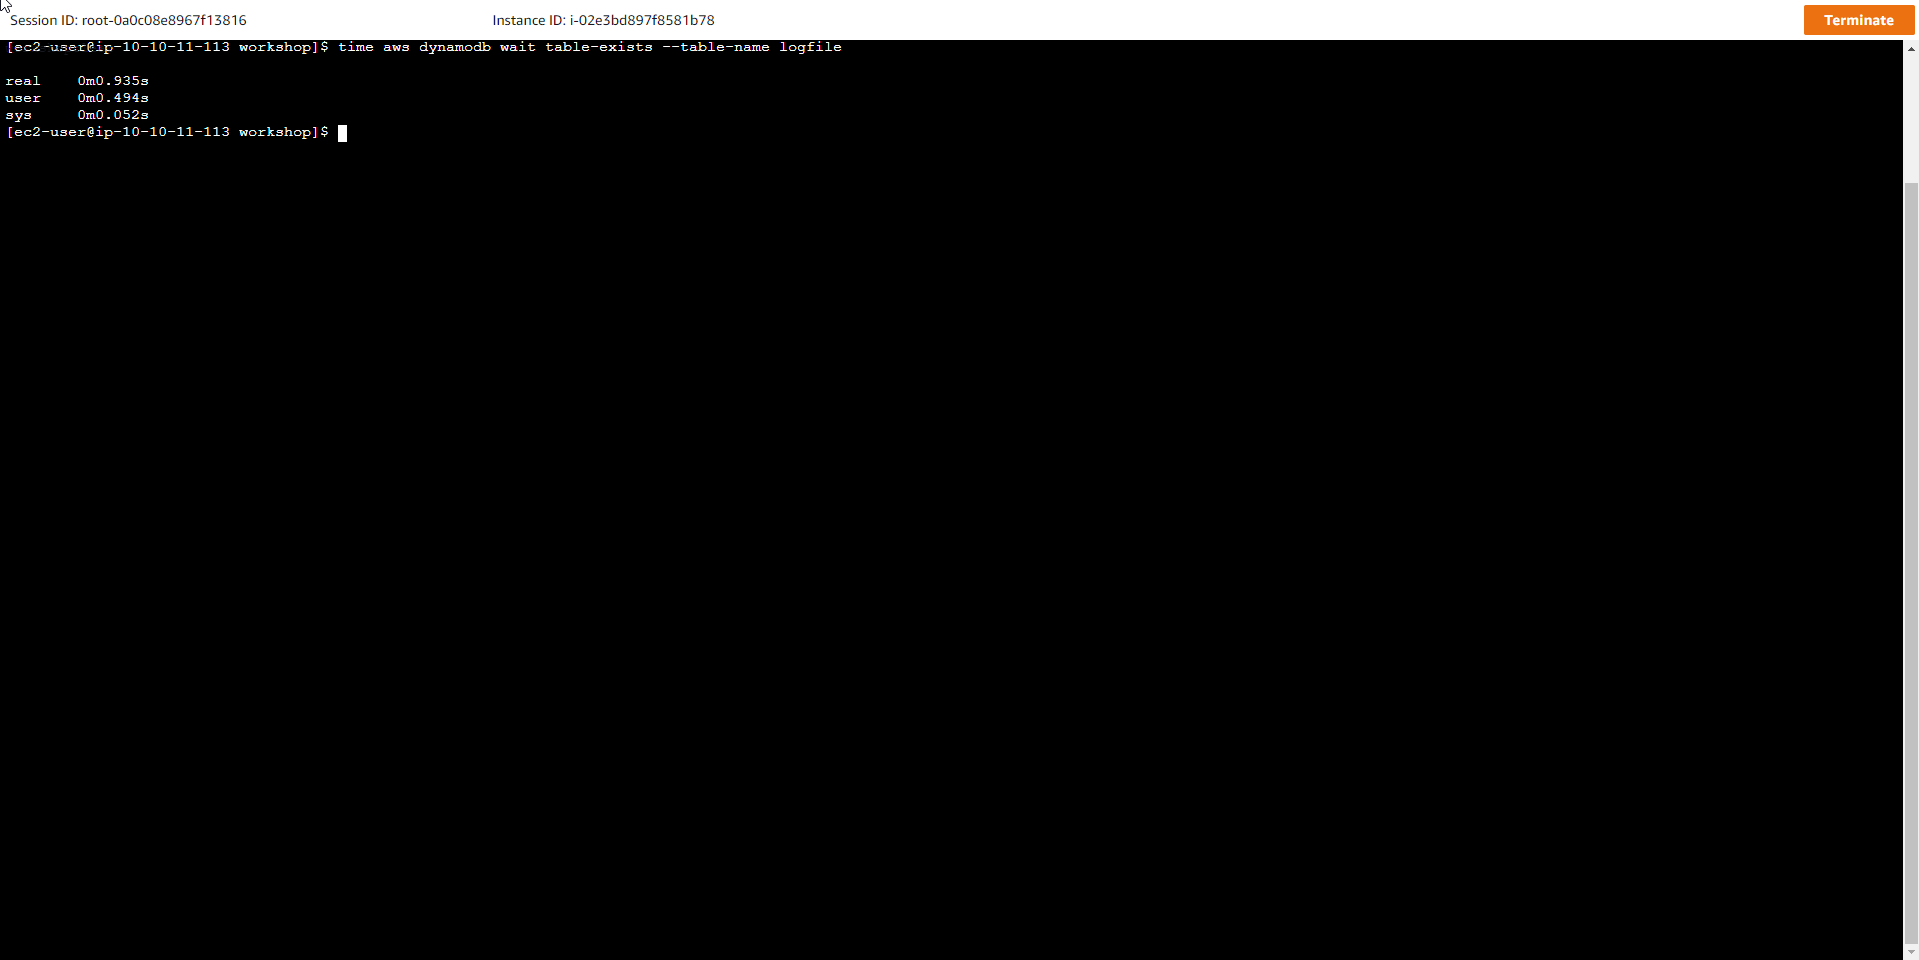
- In the Table interface see the logfile table has increased Read capacity mode and Write capacity mode to Provisioned (100)
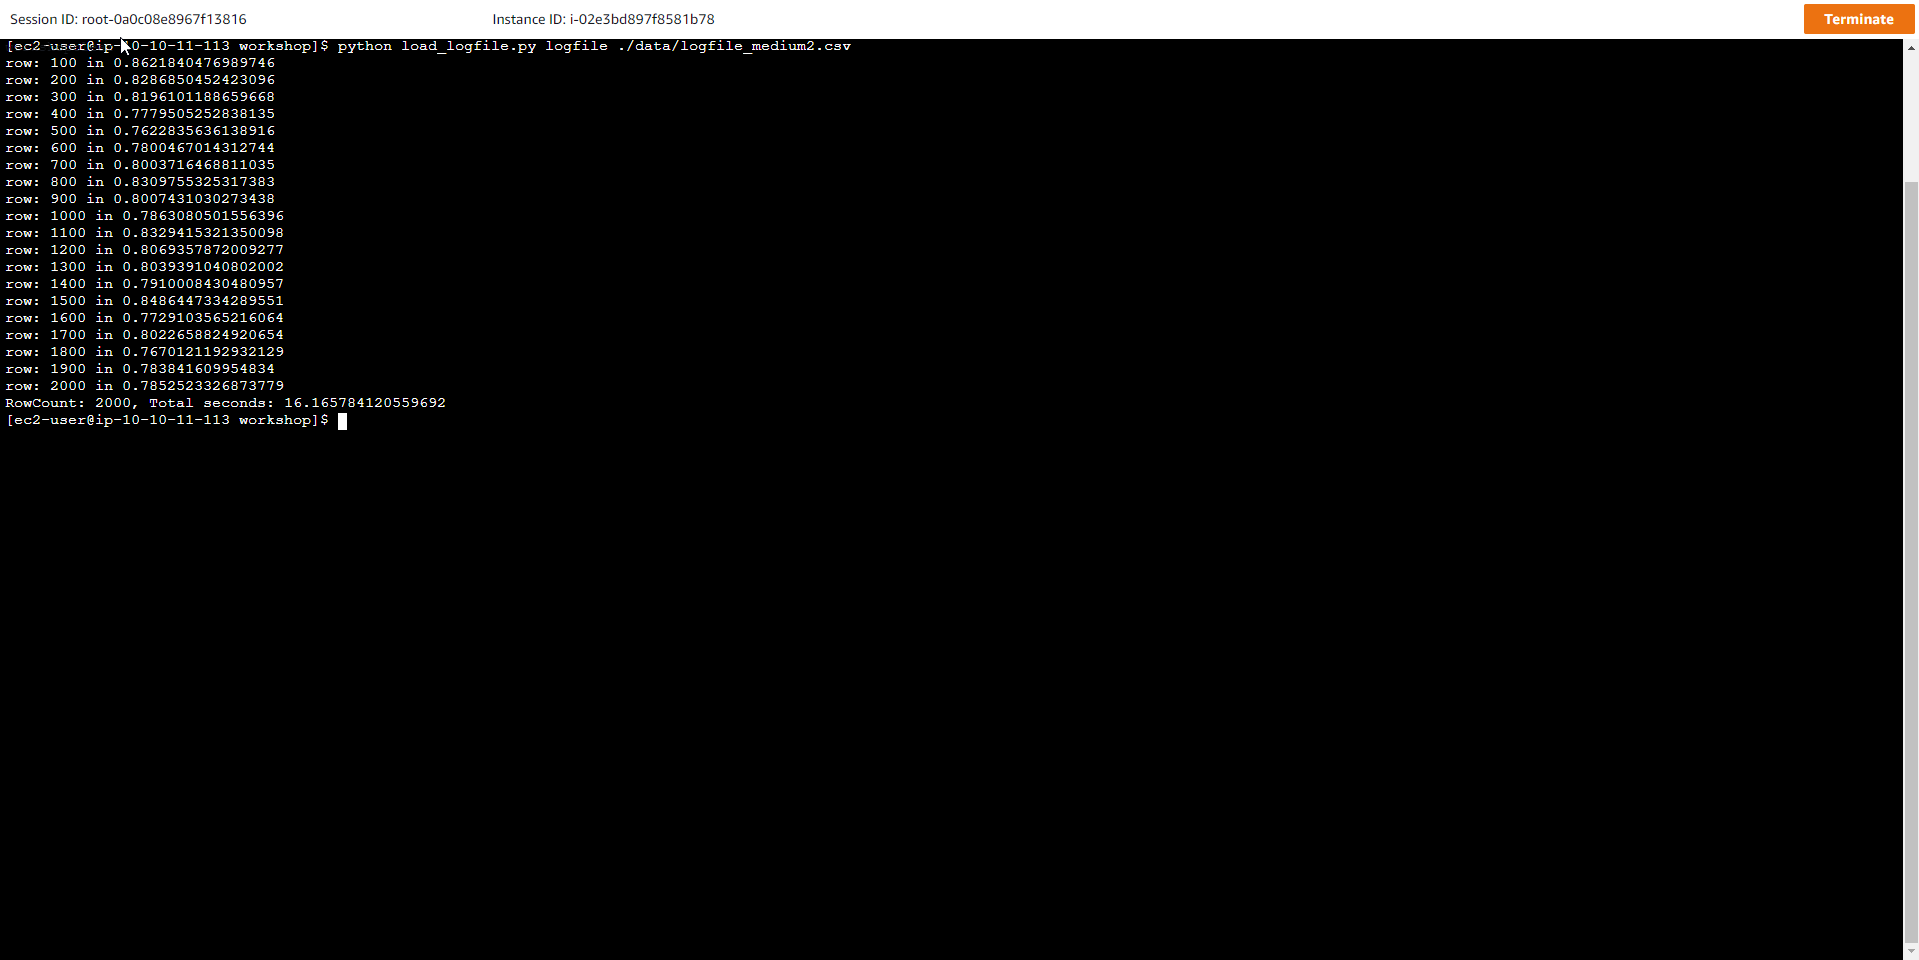
- Reload large-size data. After increasing the processing capacity for the table, run the script again to push the data from the logfile_medium2.csv file into the table.
python load_logfile.py logfile ./data/logfile_medium2.csv
The results show that the total loading time is smaller than when performing the previous step
row: 100 in 0.9451174736022949
row: 200 in 0.8512668609619141
...
row: 1900 in 0.8499886989593506
row: 2000 in 0.8817043304443359
RowCount: 2000, Total seconds: 17.13607406616211
- Create a new table with low capacity GSI Index table
- Now we will create a table with a different capacity than the examples above. The new table will have a GSI index with low capacity table, specifically write capacity is 1 WCU and read capacity is 1 RCU. To create a new table, use the following command:
aws dynamodb create-table --table-name logfile_gsi_low \
--attribute-definitions AttributeName=PK,AttributeType=S AttributeName=GSI_1_PK,AttributeType=S \
--key-schema AttributeName=PK,KeyType=HASH \
--provisioned-throughput ReadCapacityUnits=1000,WriteCapacityUnits=1000 \
--tags Key=workshop-design-patterns,Value=targeted-for-cleanup \
--global-secondary-indexes "IndexName=GSI_1,\

KeySchema=[{AttributeName=GSI_1_PK,KeyType=HASH}],\
Projection={ProjectionType=INCLUDE,NonKeyAttributes=['bytessent']},\
ProvisionedThroughput={ReadCapacityUnits=1,WriteCapacityUnits=1}"

- Run the command to wait until the table transitions to ACTIVE
aws dynamodb wait table-exists --table-name logfile_gsi_low
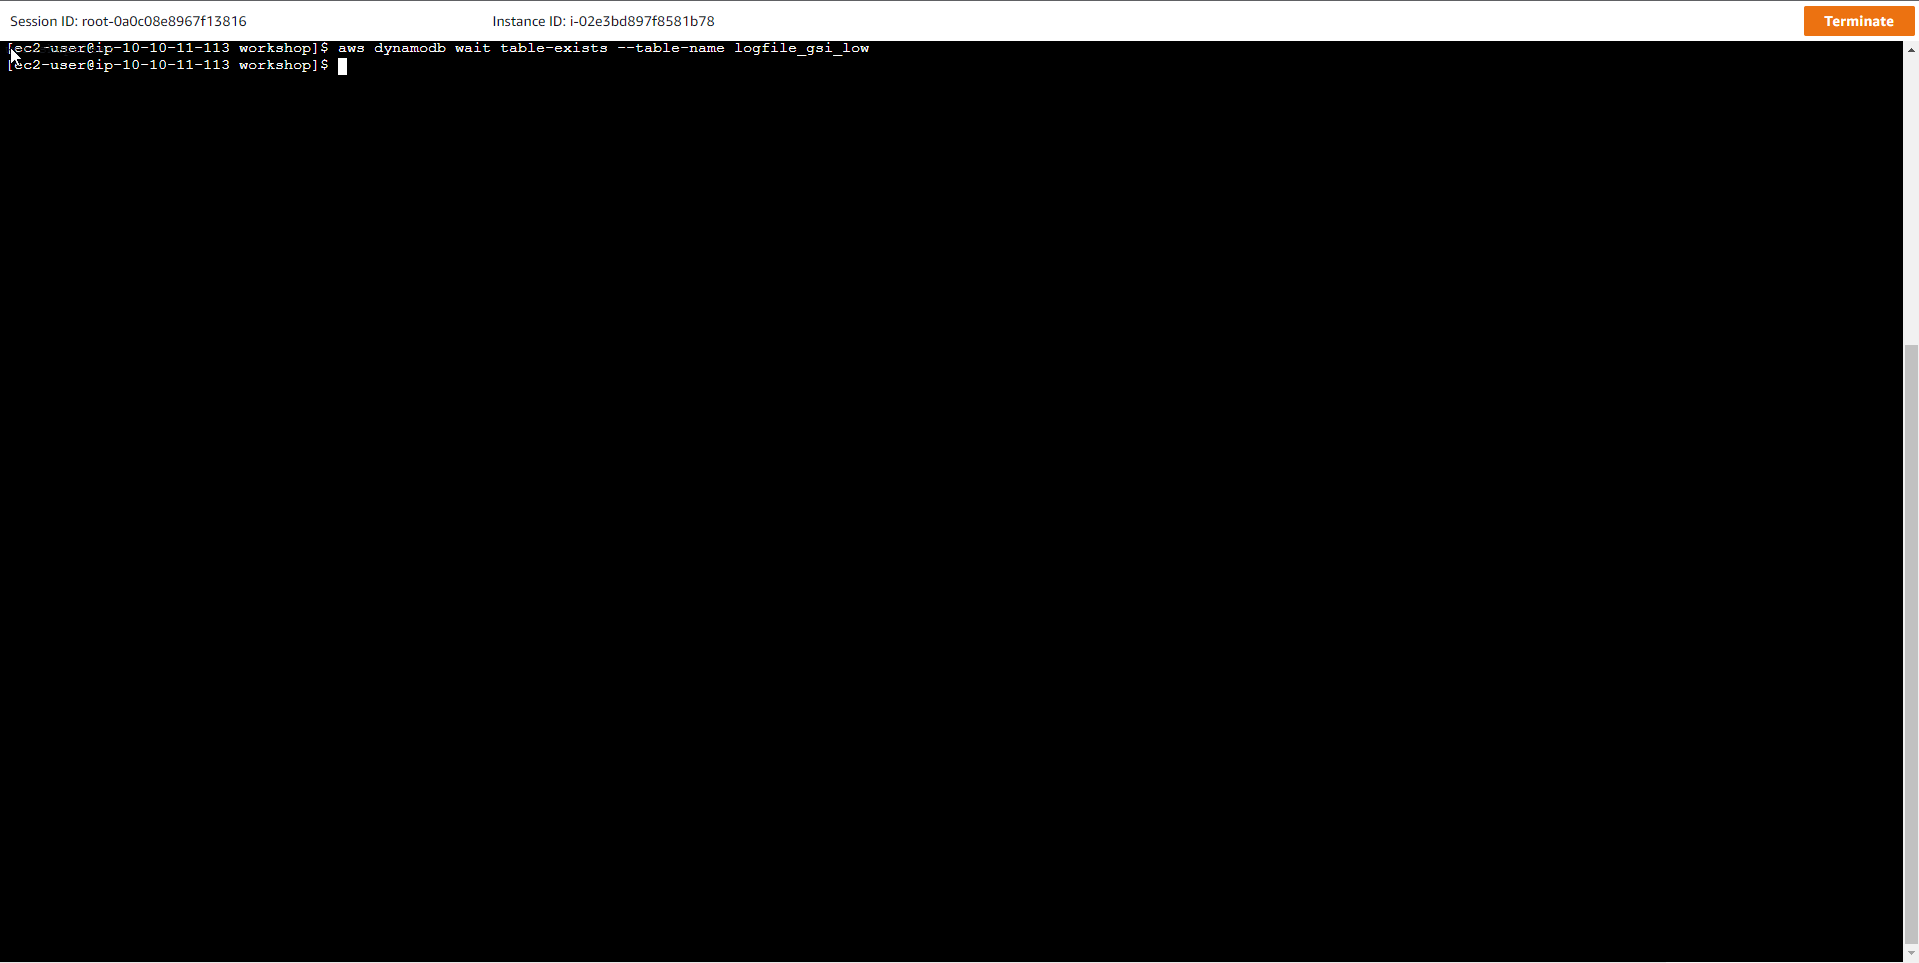
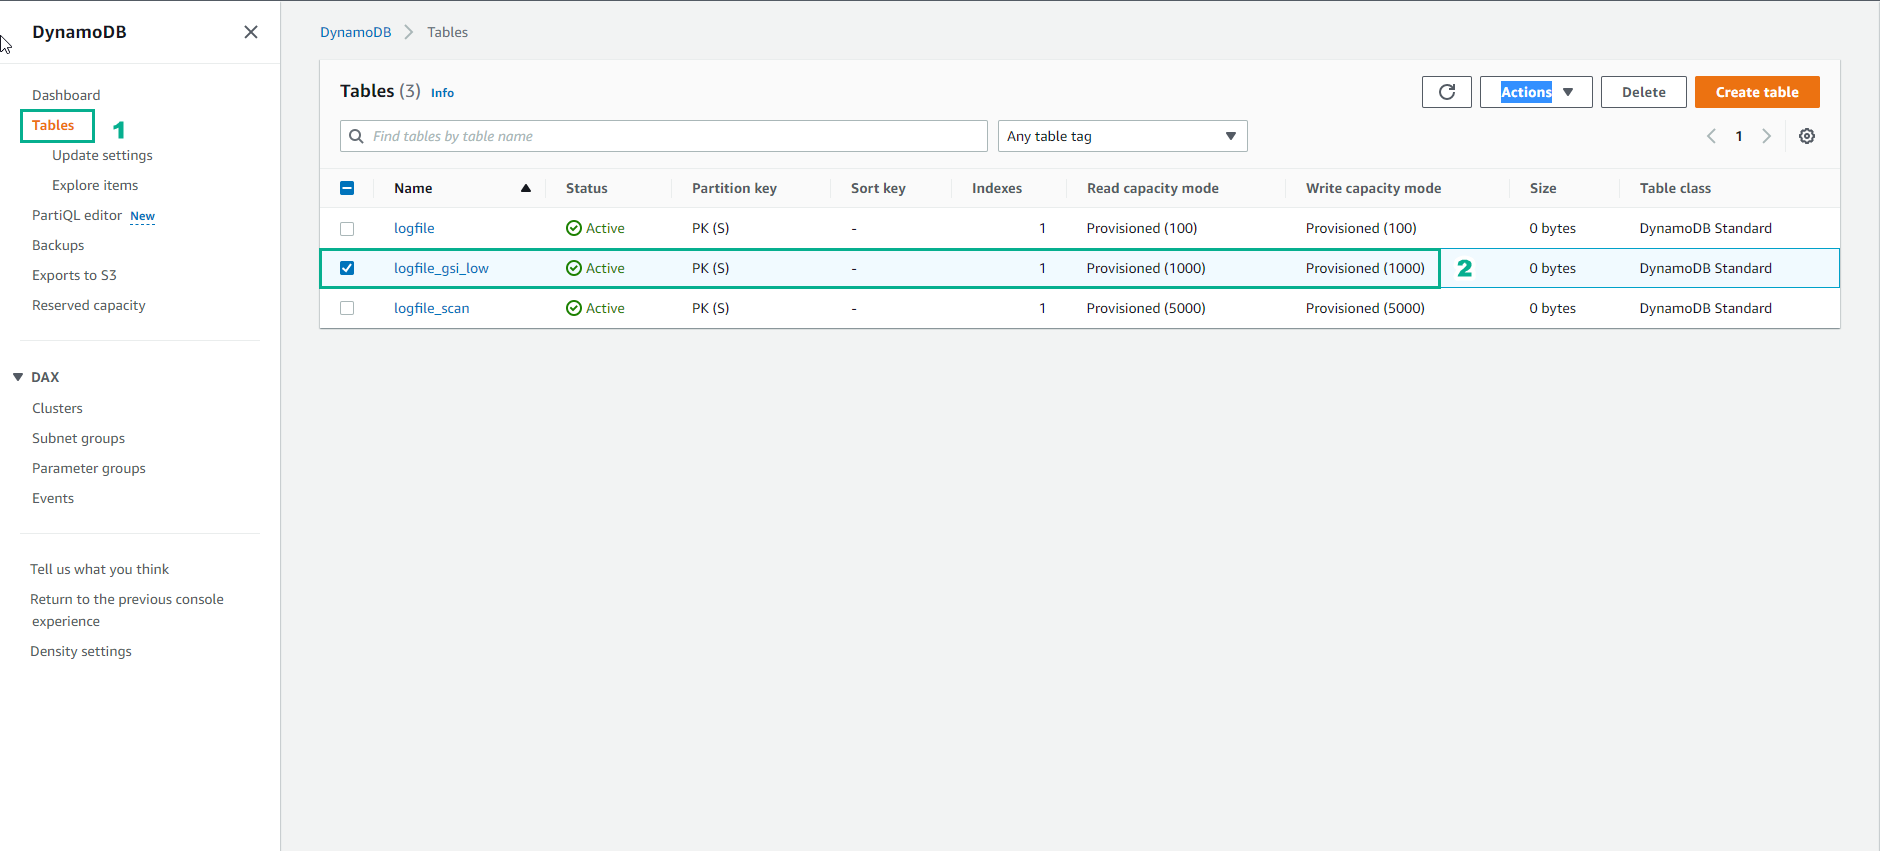
- In the DyanmoDB table view, the logfile_gsi_low table has been created and the status is Active
The command creates the logfile_gsi_low table with:
-
Key schema: HASH (partition key)
-
Table read capacity units (RCUs) = 1000
-
Table write capacity units (WCUs) = 1000
-
Global secondary index: GSI_1 (1 RCU, 1 WCU) - allows querying with host IP address
- Then we push a large data set into the newly created table, the purpose is to simulate an increase in traffic, creating a conflict between the allocated capacity and the actual capacity needed.
python load_logfile_parallel.py logfile_gsi_low
- After a few minutes of execution, an error message appears stating that a data bottleneck has occurred and needs to increase the amount of space allocated to the DynamoDB table, or enable autoscale for the table.
ProvisionedThroughputExceededException: An error occurred (ProvisionedThroughputExceededException) when calling the BatchWriteItem operation (reached max retries: 9): The level of configured provisioned throughput for one or more global secondary indexes of the table was exceeded. Consider increasing your provisioning level for the under-provisioned global secondary indexes with the UpdateTable API
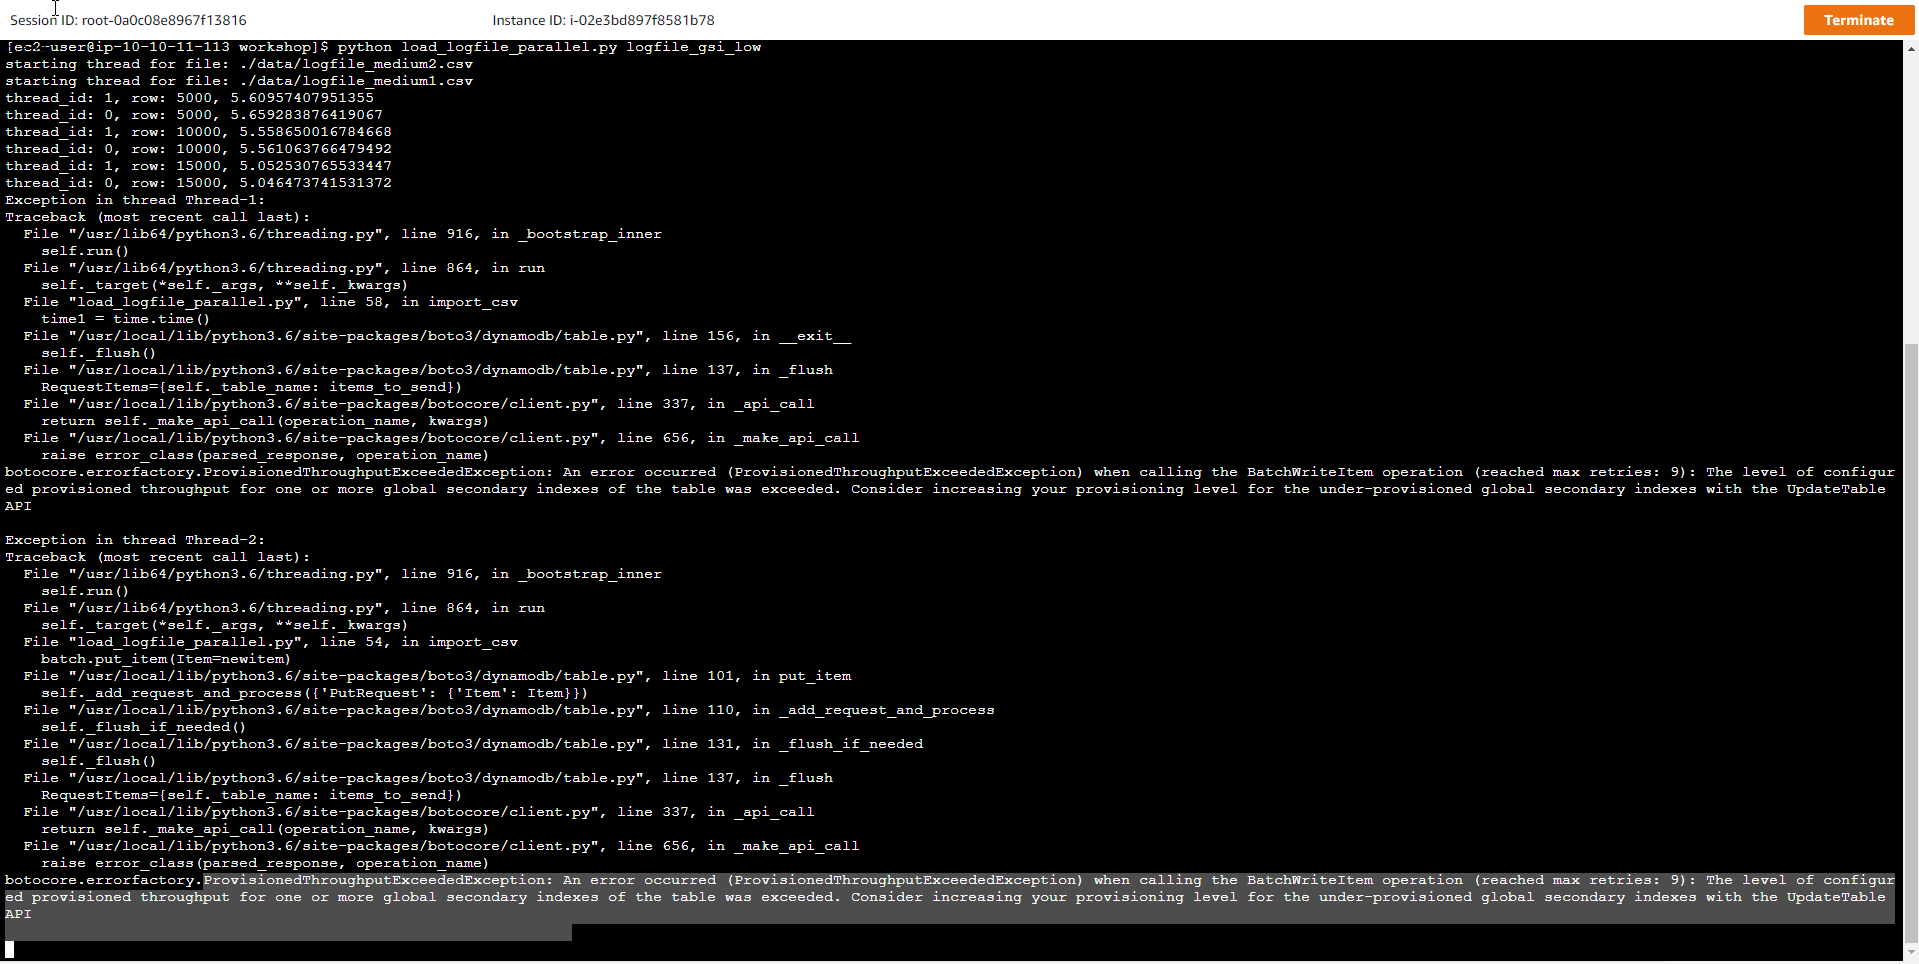
The question here is, why does our new table have WCU=1000 and RCU=1000 still there is a bottleneck when writing data from the new file to the table, and Loading time is also greatly increased. A closer look at the error message shows that the exception named ProvisionedThroughputExceededException caught a data congestion error, specifically the throughput allocated to the GSI Index table has been exceeded. Thus we will have to increase the processing capacity for the Index table because currently the capacity for the Index table is extremely low with 1 RCU and 1 WCU. As it works, if you want the Base table to operate with 100% write capacity allocated, the corresponding Index table must also have a Write capacity equal to the Write capacity of the Base table. In this case, the Write Capacity of the Index table needs to be reset to WCU=1000
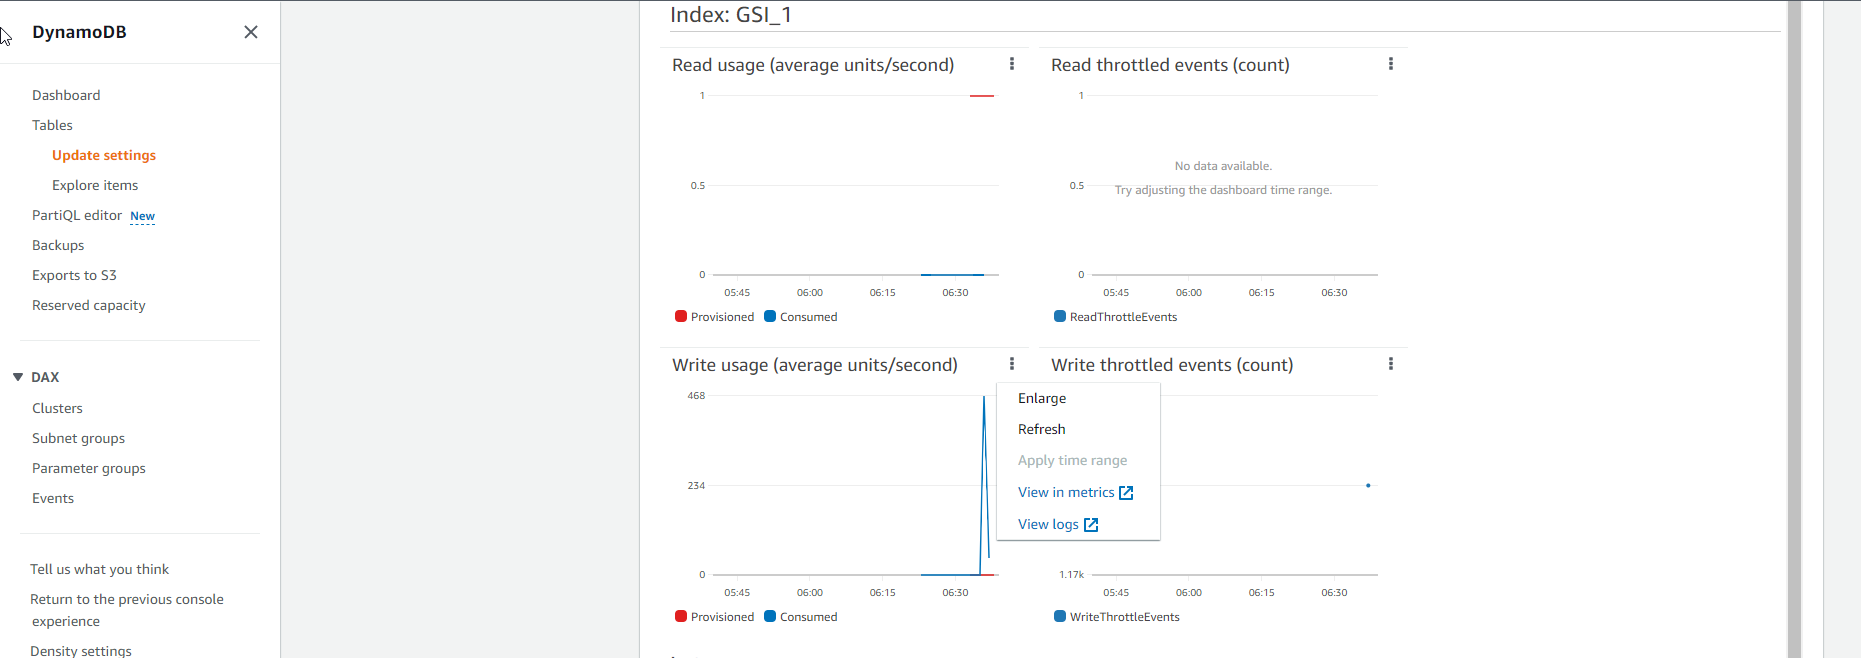
- The cause of the error and how to fix it is very clear. But if we want to take a closer look at the CloudWatch metric, then at the DynamoDB console page, click Table and then select the table named logfile_gsi_low.
- Select Write usage
- Select View in metrics
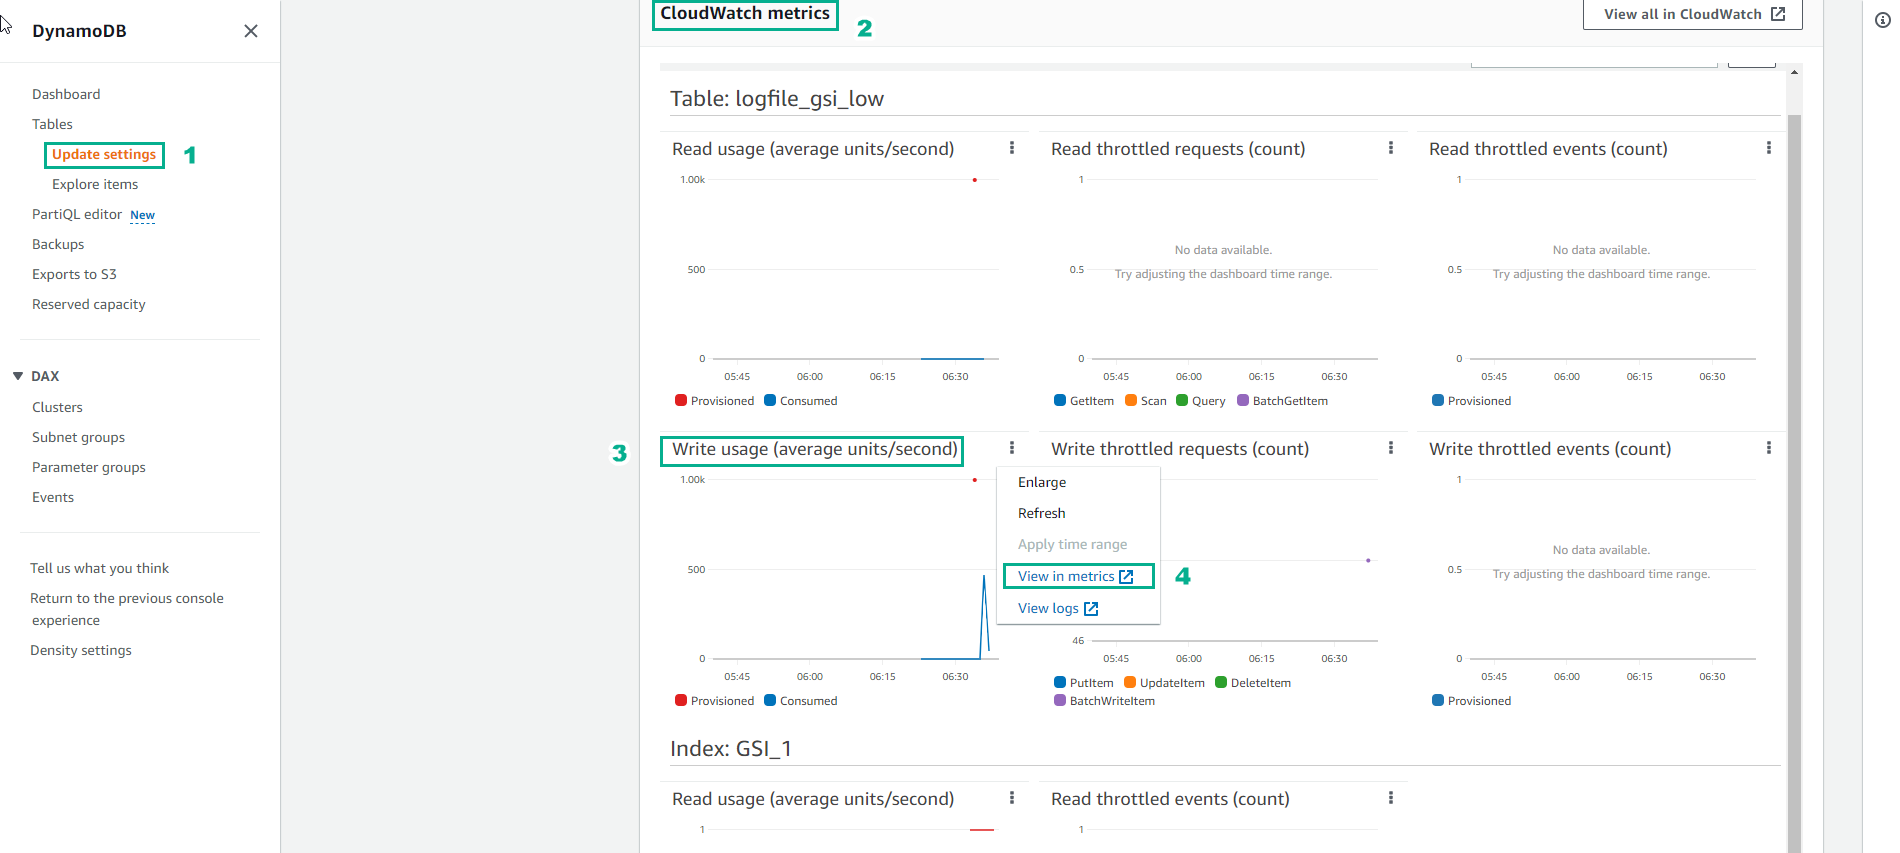
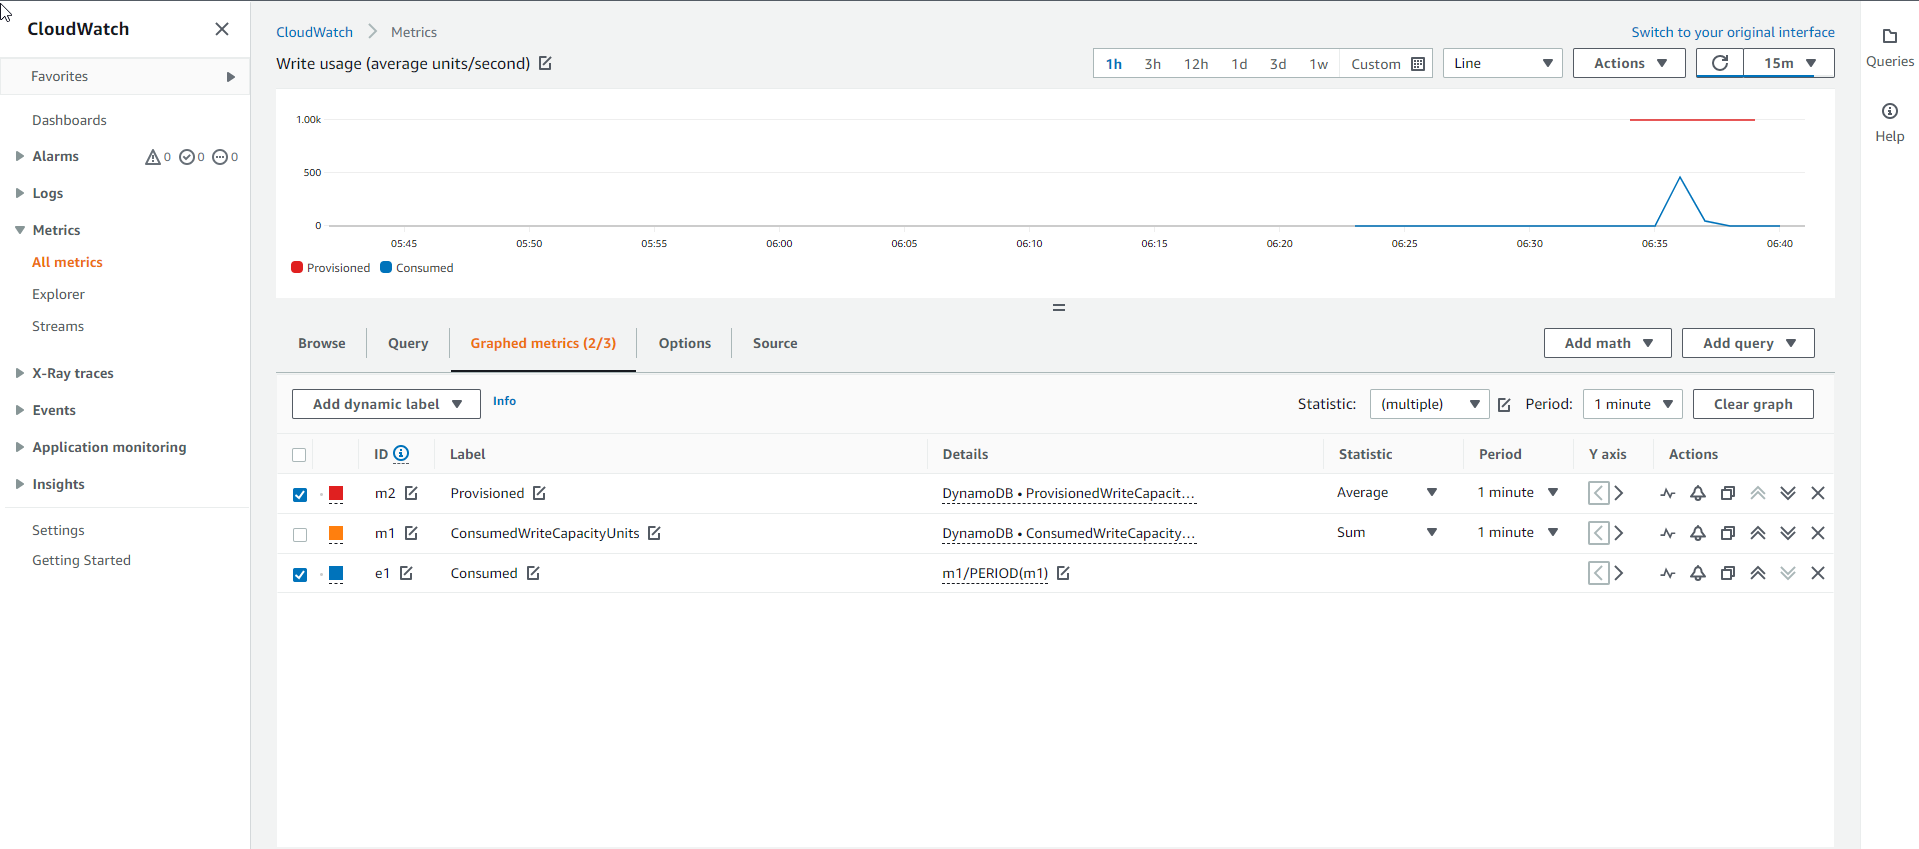
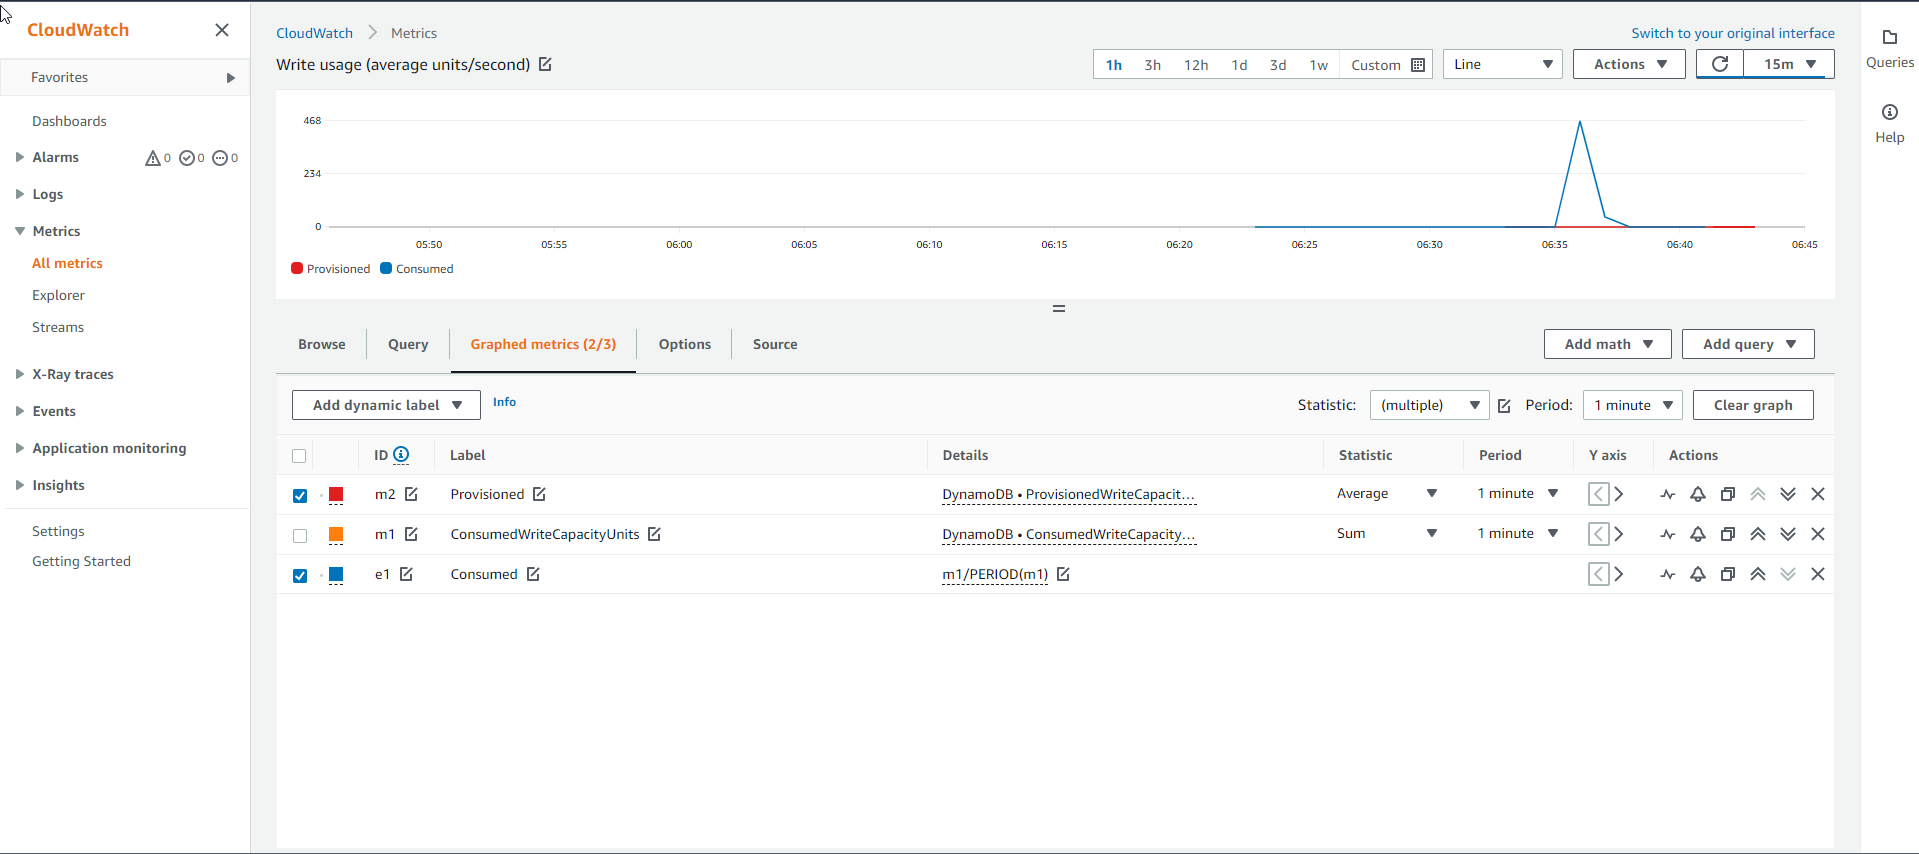
- The image below shows the Base table’s Write capacity chart. The blue line shows the actual consumed write capacity, and the red line is the allocated write capacity. Since the blue line is below that color line, it can be concluded that the Base table has a Write capacity suitable for the sudden increase in requests.
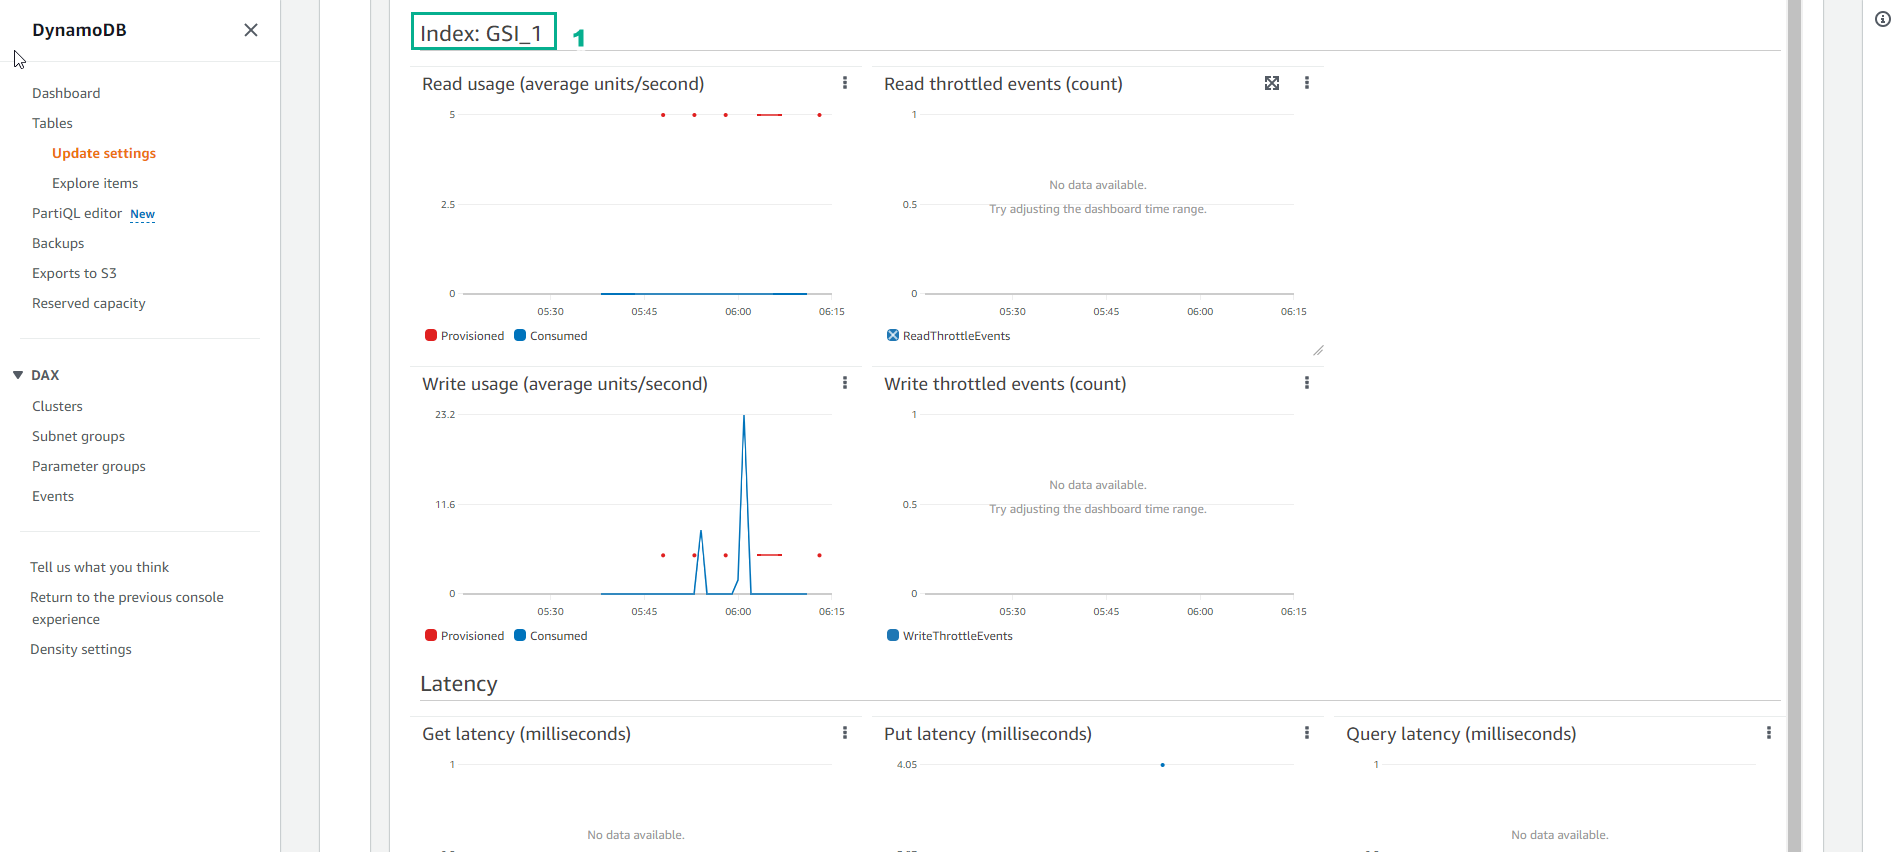
- See Index: GSI_1
- As for the chart of the Write capacity of the Index table as shown below, it shows that the actual consumed Write capacity line (blue line) is above the allocated Write capacity line (red line). This indicates that the GSI Index table needs to be allocated more capacity to accommodate the sudden increase in requests.
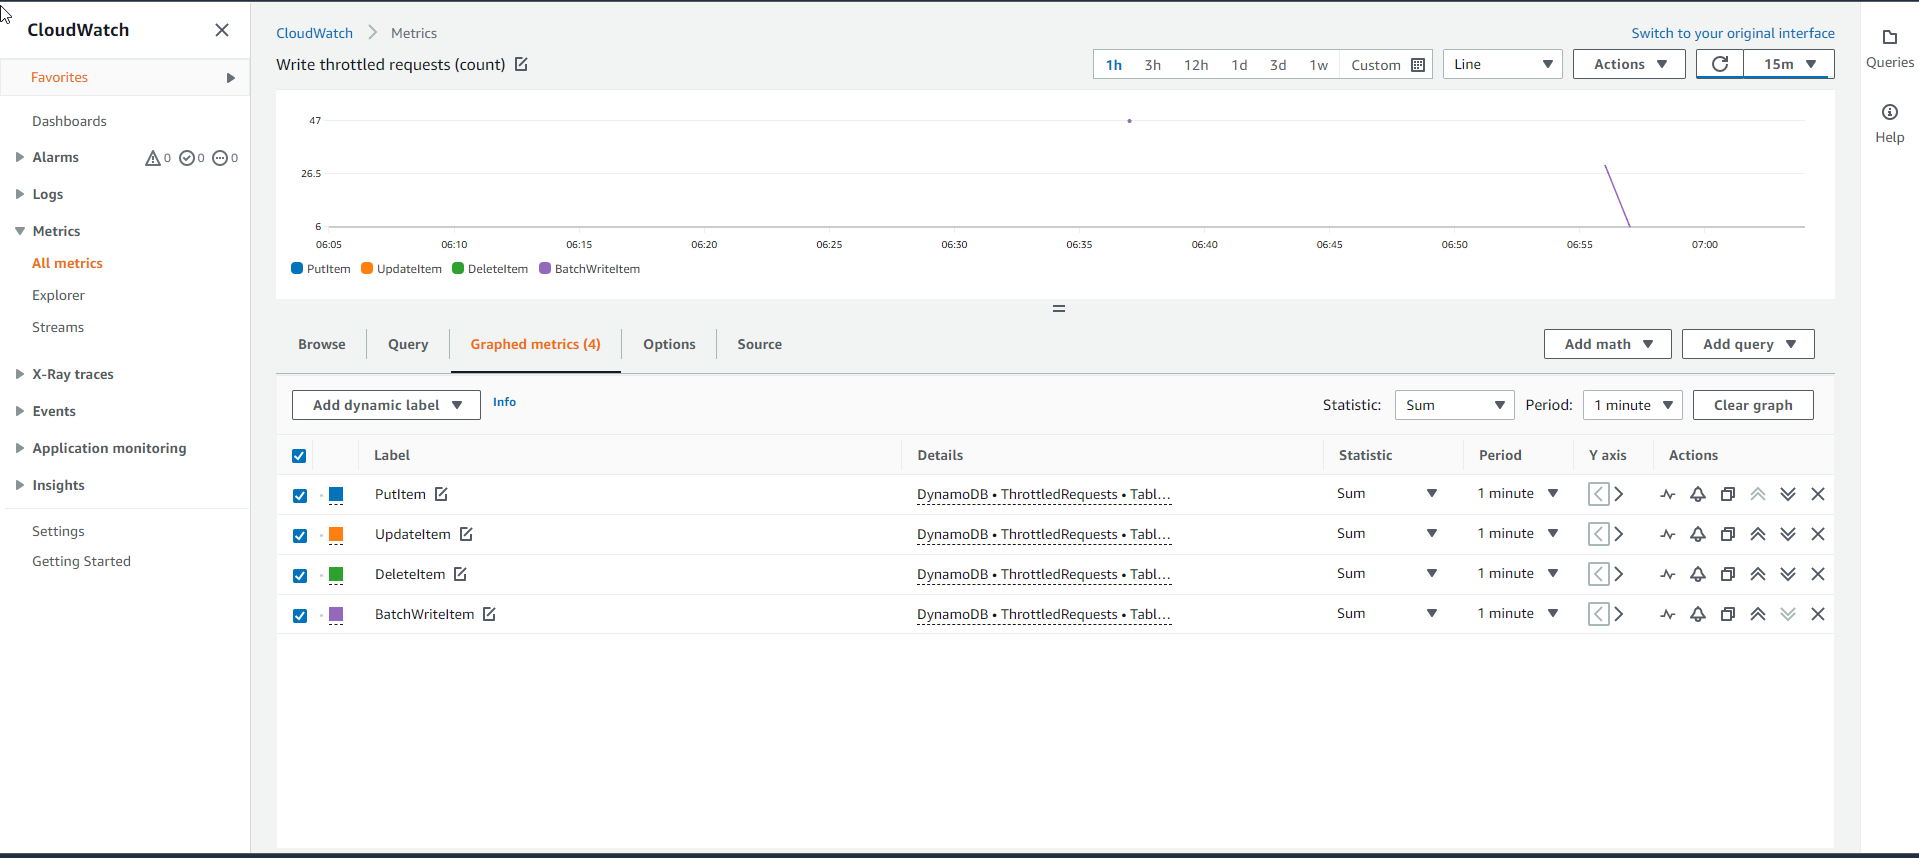
- Even though the Base table logfile_gsi_low has the Write capacity met, when checking the Throttled write requests graph, it still shows a line showing the number of congested requests. Any API requests that are congested are logged in the ThrottledRequests metrics graph. As we can see below, there are more than 20 API requests blocked.
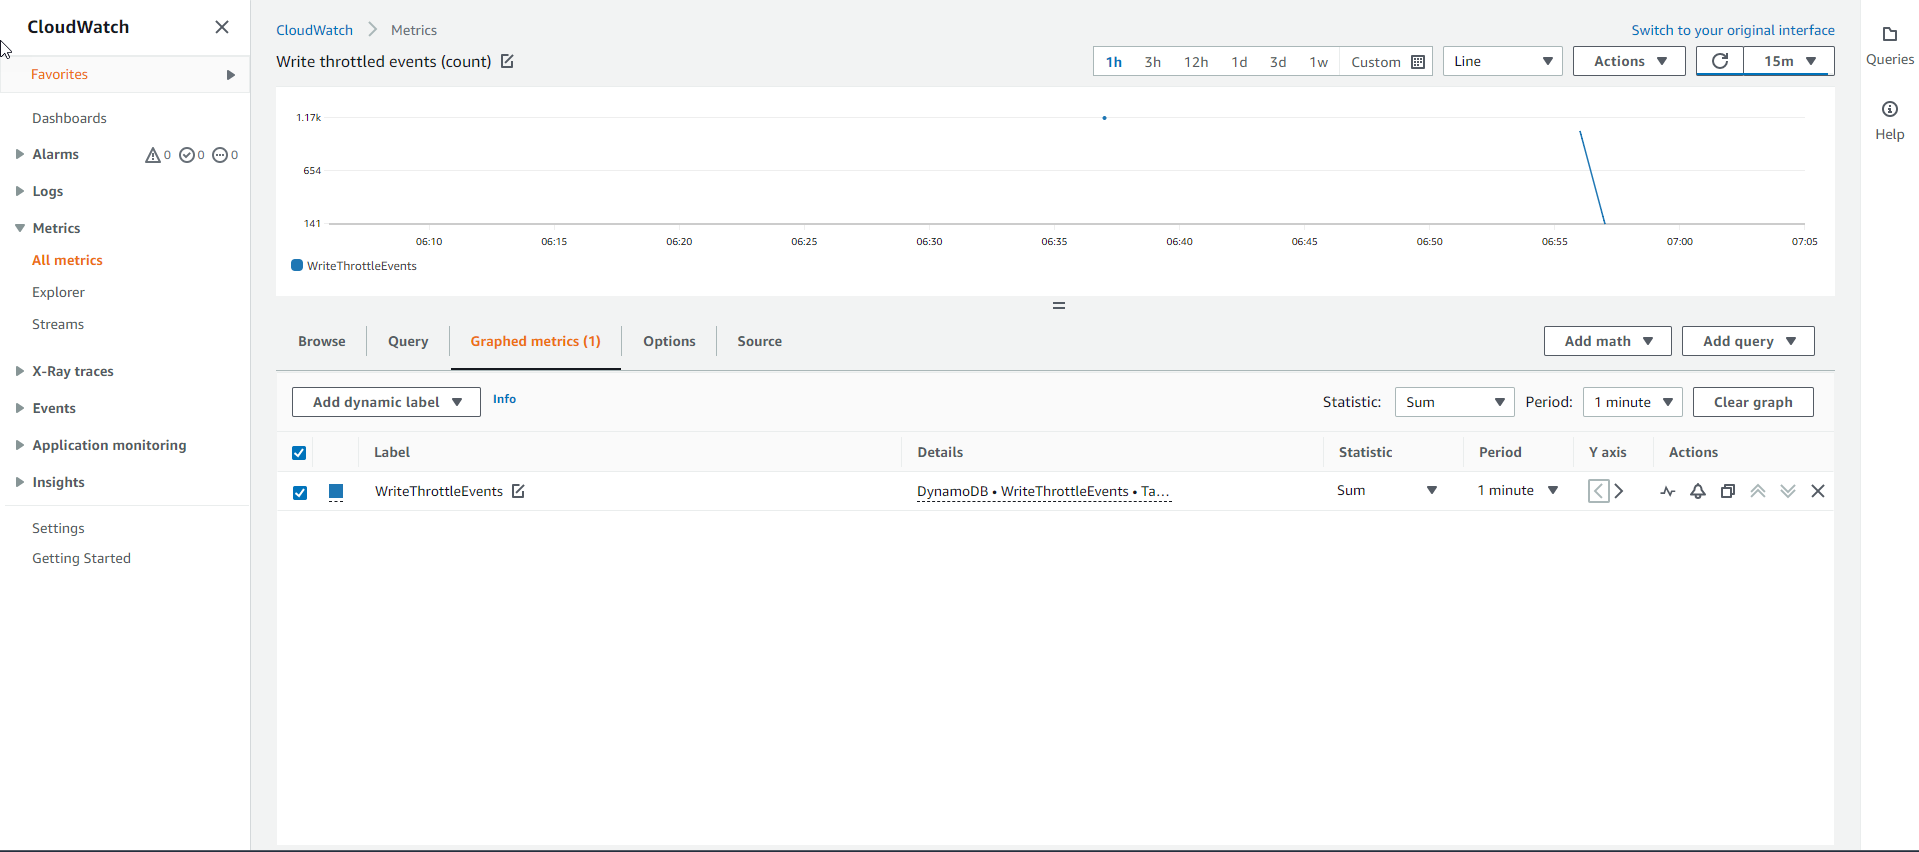
- To determine the source of the bottleneck of Write requests, we will need to examine the Throttled Write Events metric graph. If the Base table was the source of the bottleneck it would have to have WriteThrottleEvents, otherwise the GSI Index table.
- And after checking, we see that only the GSI Index table has WriteThrottleEvents with the graph below. The cause is understandable because the Index table does not have enough Write capacity to accommodate the sudden increase in requests. Thus, the Index table is the main cause of the bottleneck for Write requests.
Conclusion:
- The capacity of the DynamoDB table is separate from the capacity of the GSI Index table. If the Index Table is not given enough capacity, it can create back pressure on the Base tables in the form of bottlenecks when loading data.
- It will cause all write requests to the Base table to be denied until the buffer between the Base table and the GSI Index table is freed and there is enough space for new data.
- Always monitor CloudWatch metrics on both Base and Index tables and set monitoring alerts based on your business requirements.