Step 4 - View the CloudWatch metrics on your table
To view the Amazon CloudWatch metrics for your table:
-
Navigate to the DynamoDB section of the AWS management console.
-
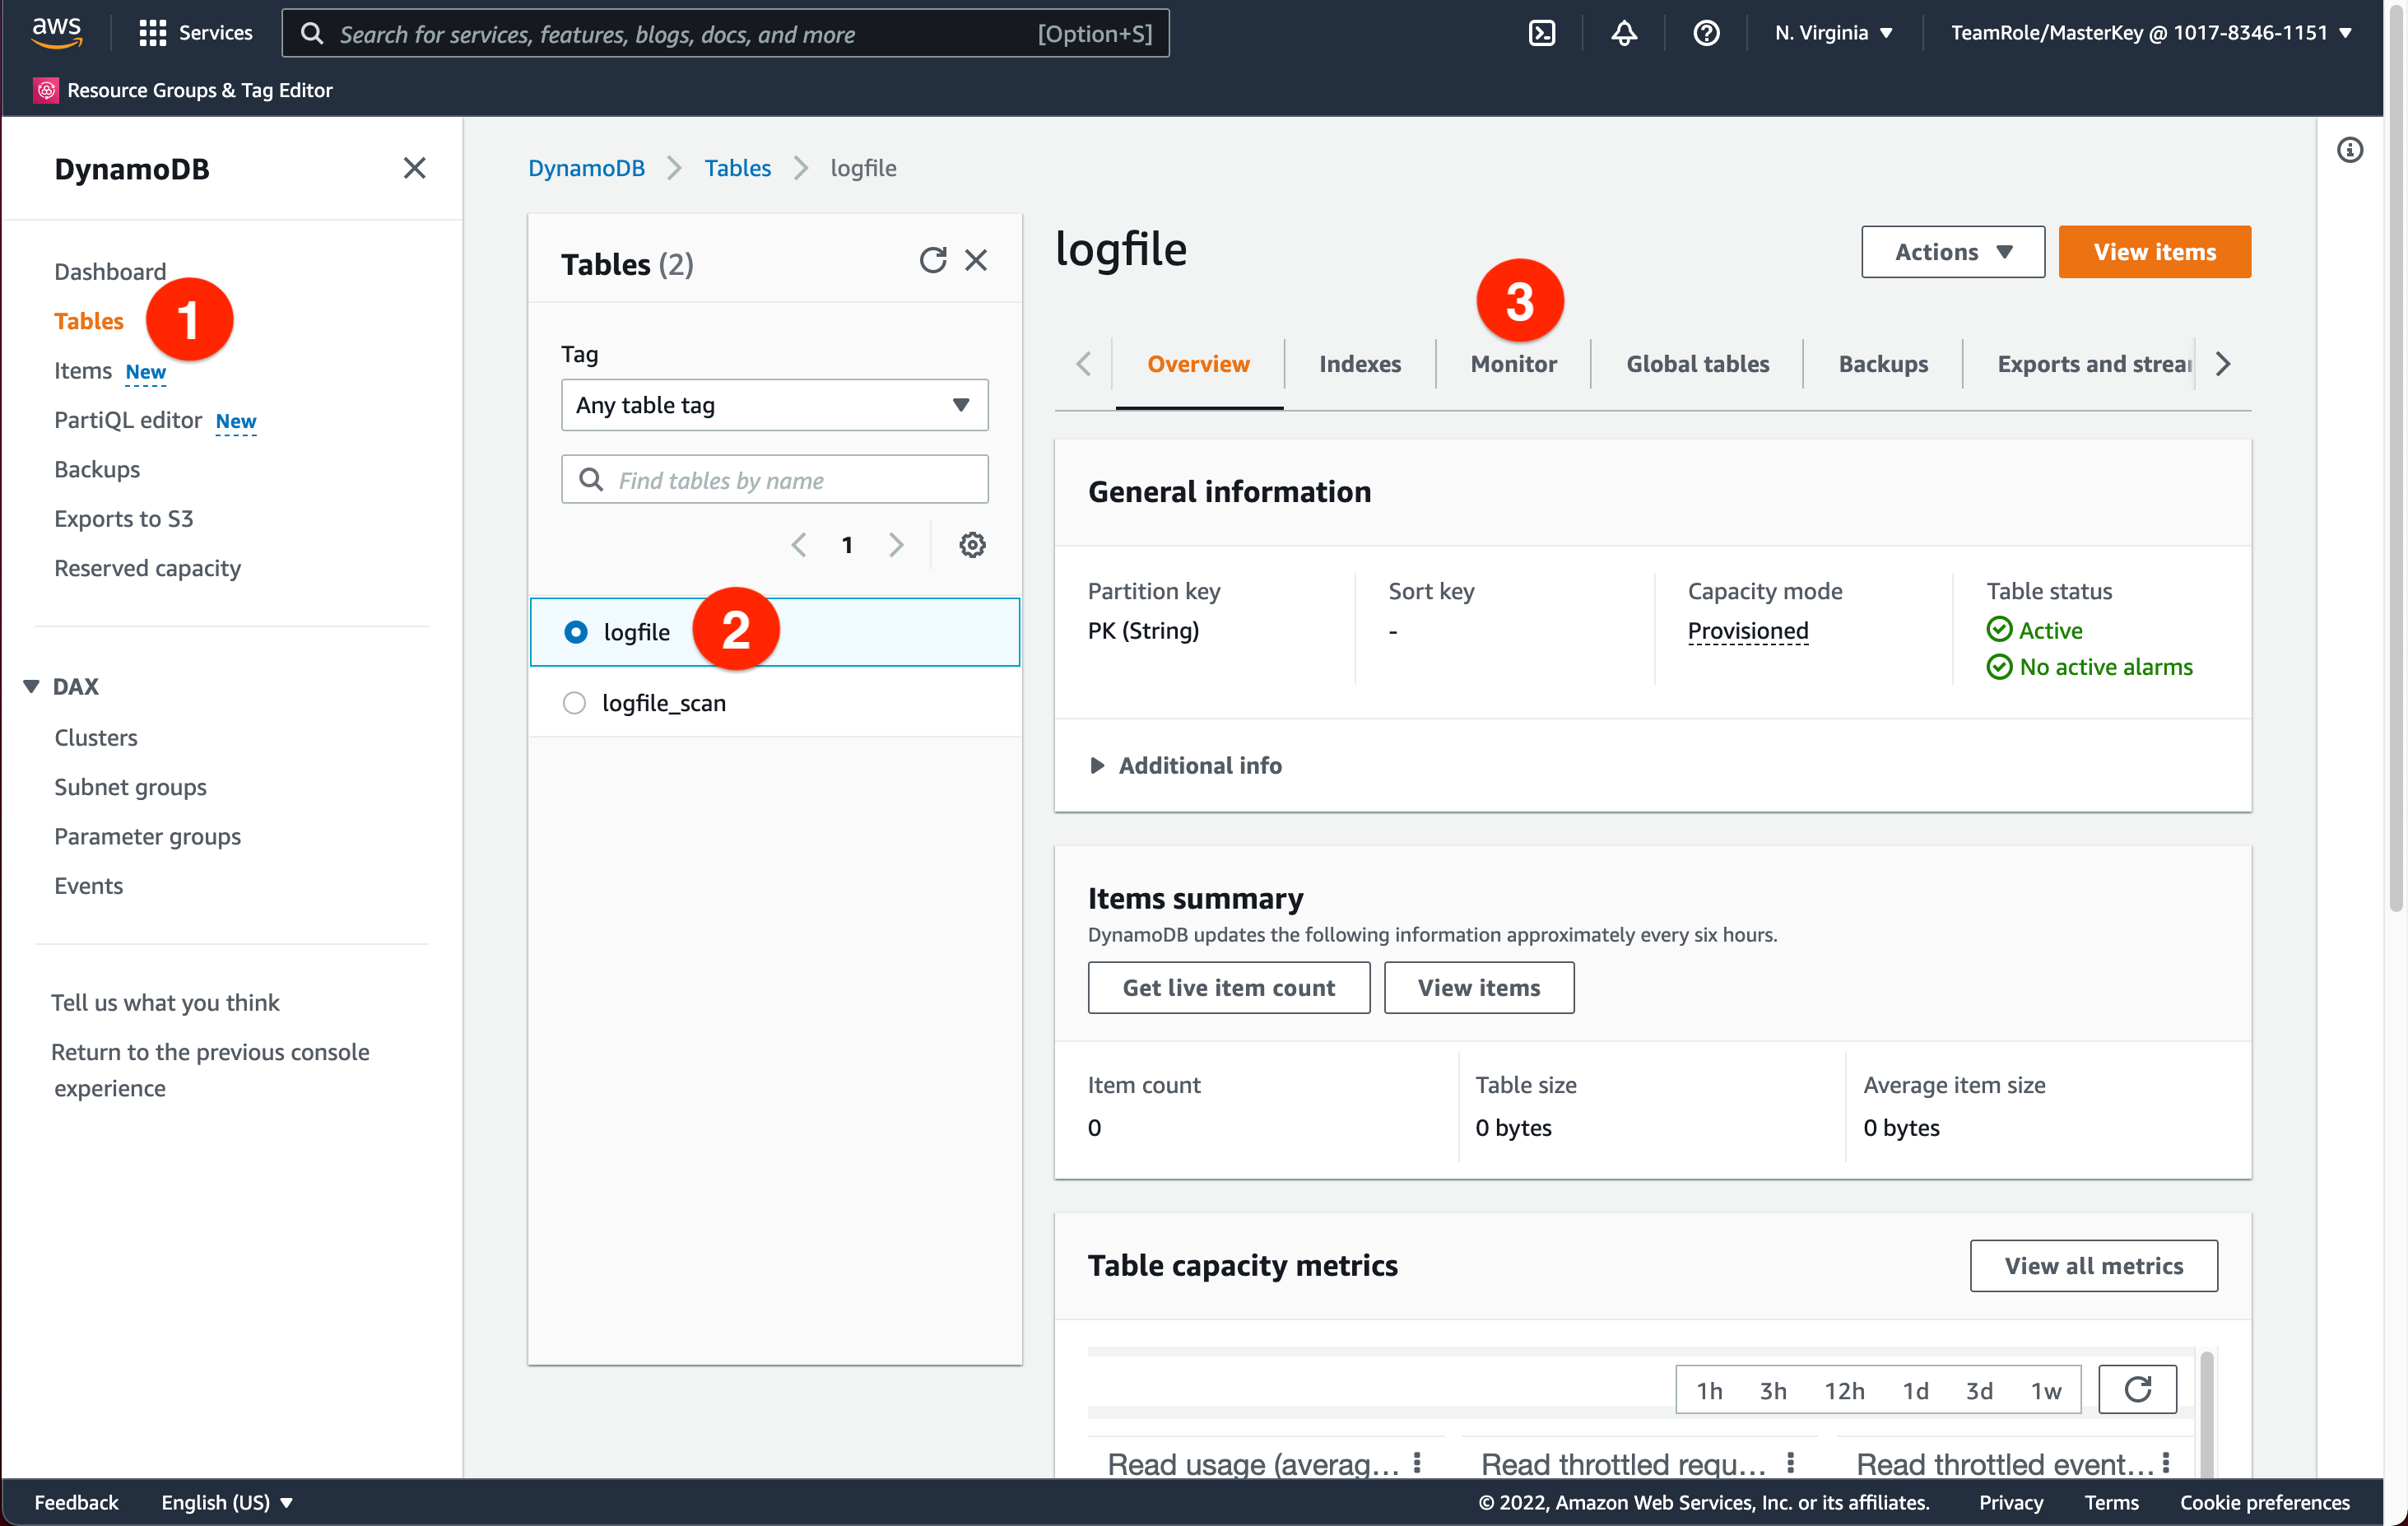
As shown in the following image, in the navigation pane, choose Tables. Choose the logfile table, and in the right pane, choose the Metrics tab
The CloudWatch metrics will look like what you see in the following image.
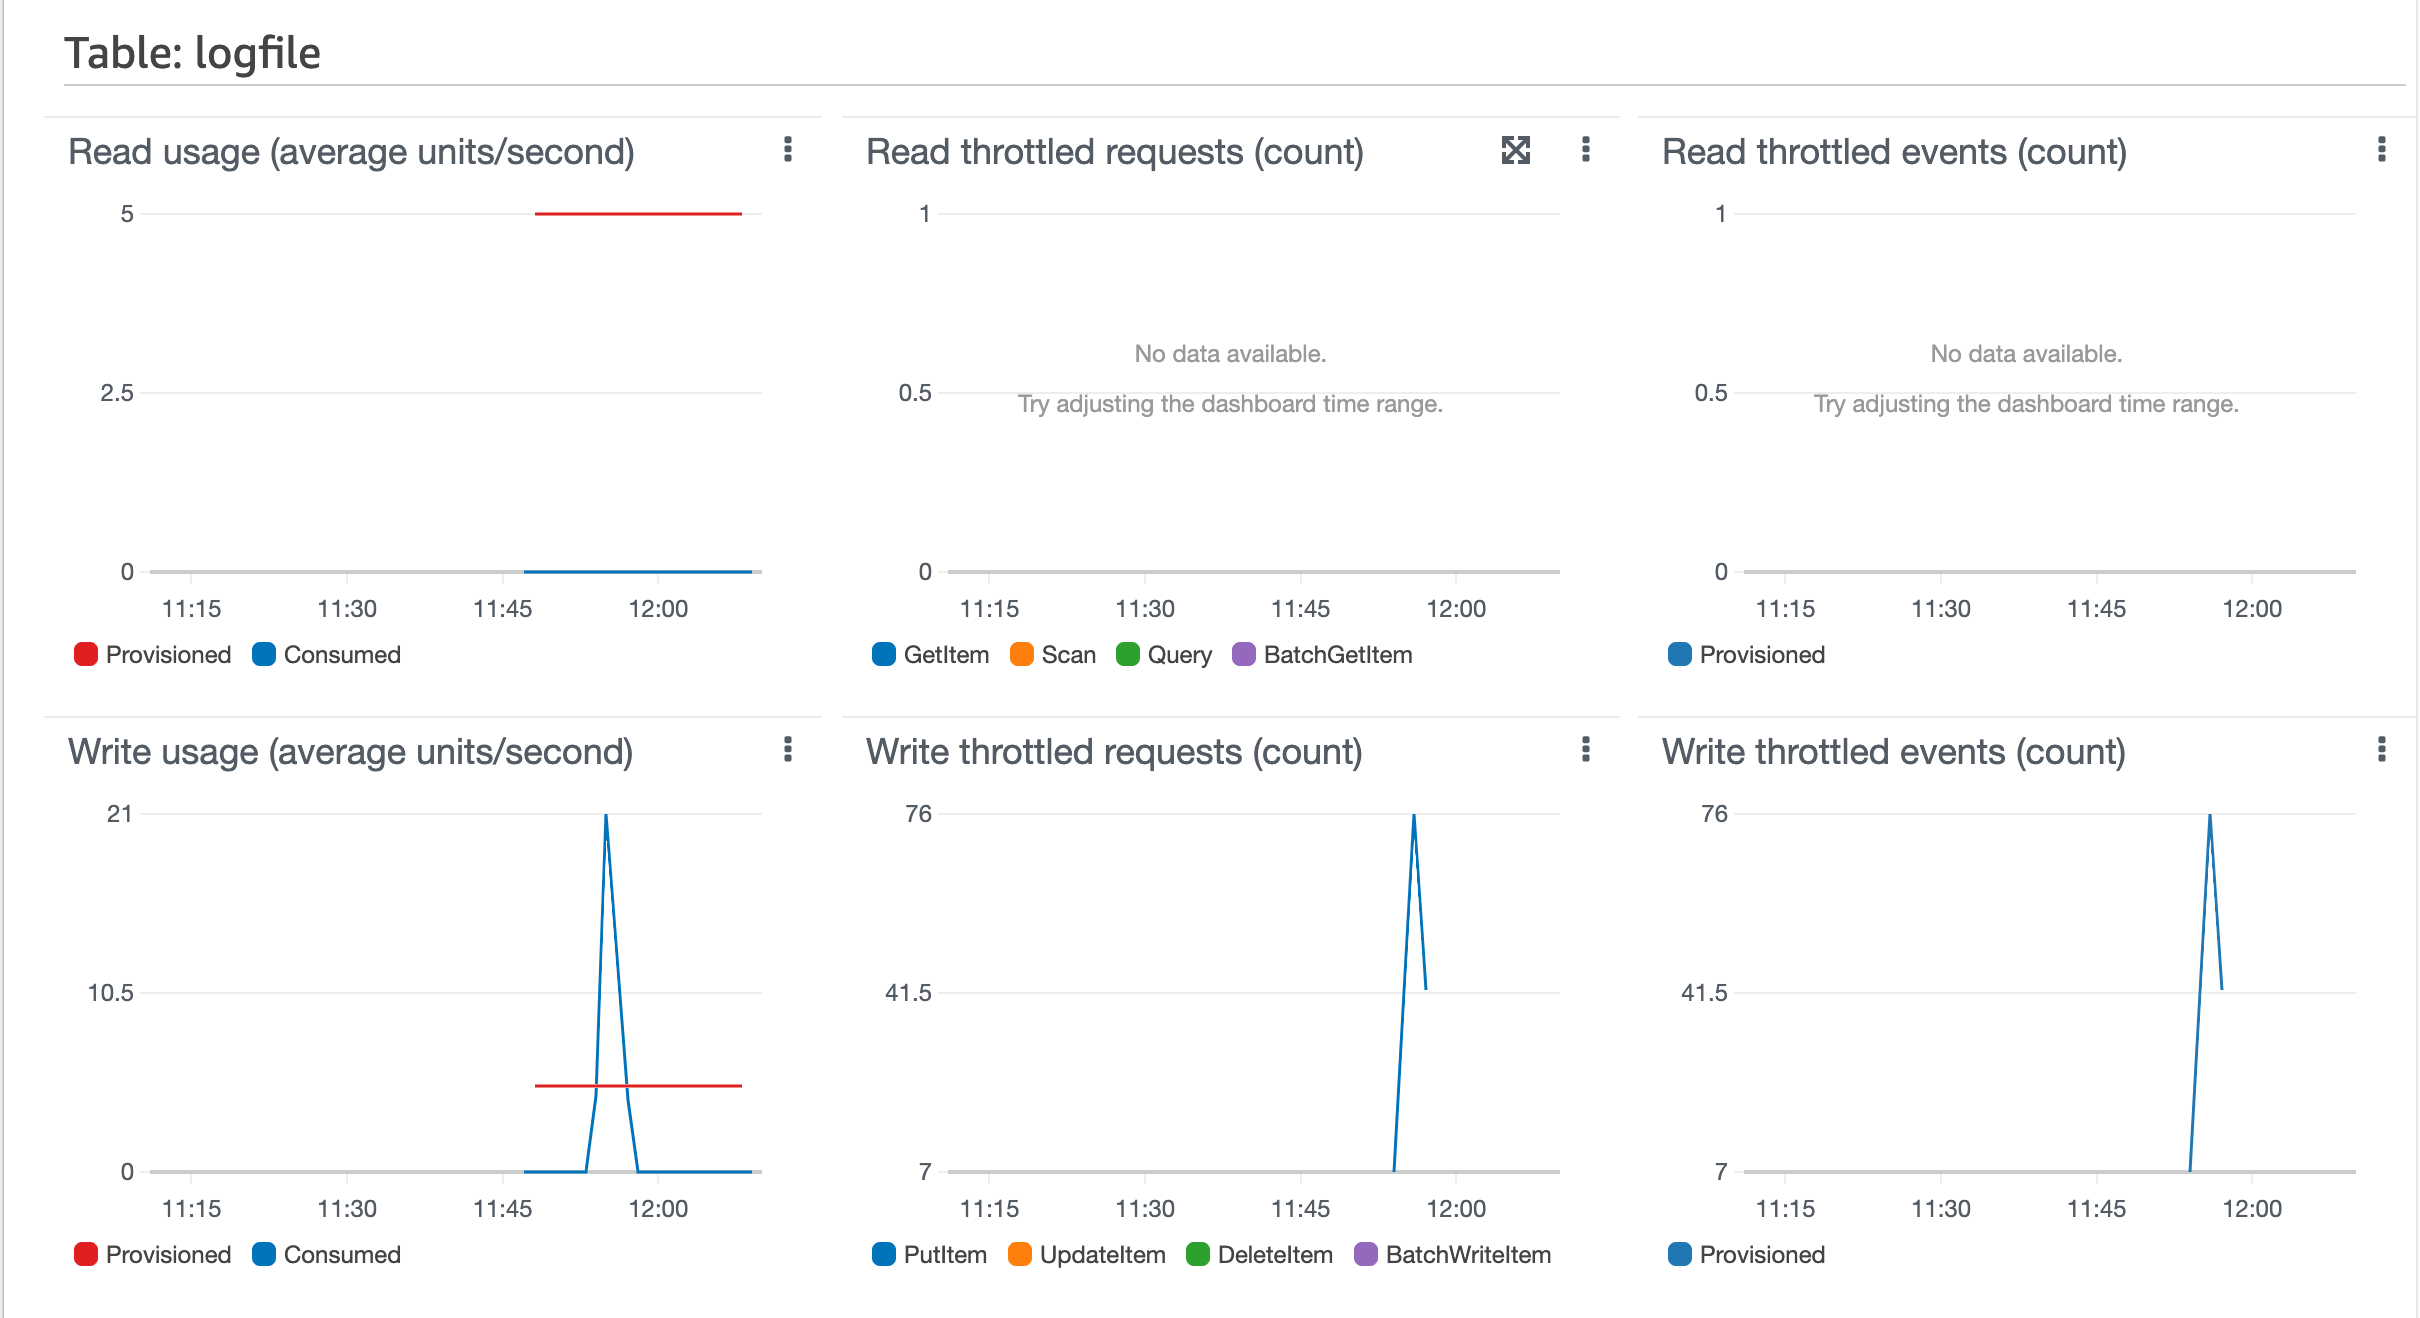
You might not see provisioned capacity data in your read or write capacity graphs, which are displayed as red lines. It takes time for DynamoDB to generate provisioned capacity CloudWatch metrics, especially for new tables.
The CloudWatch metrics will look like what you see in the following image for the global secondary index.
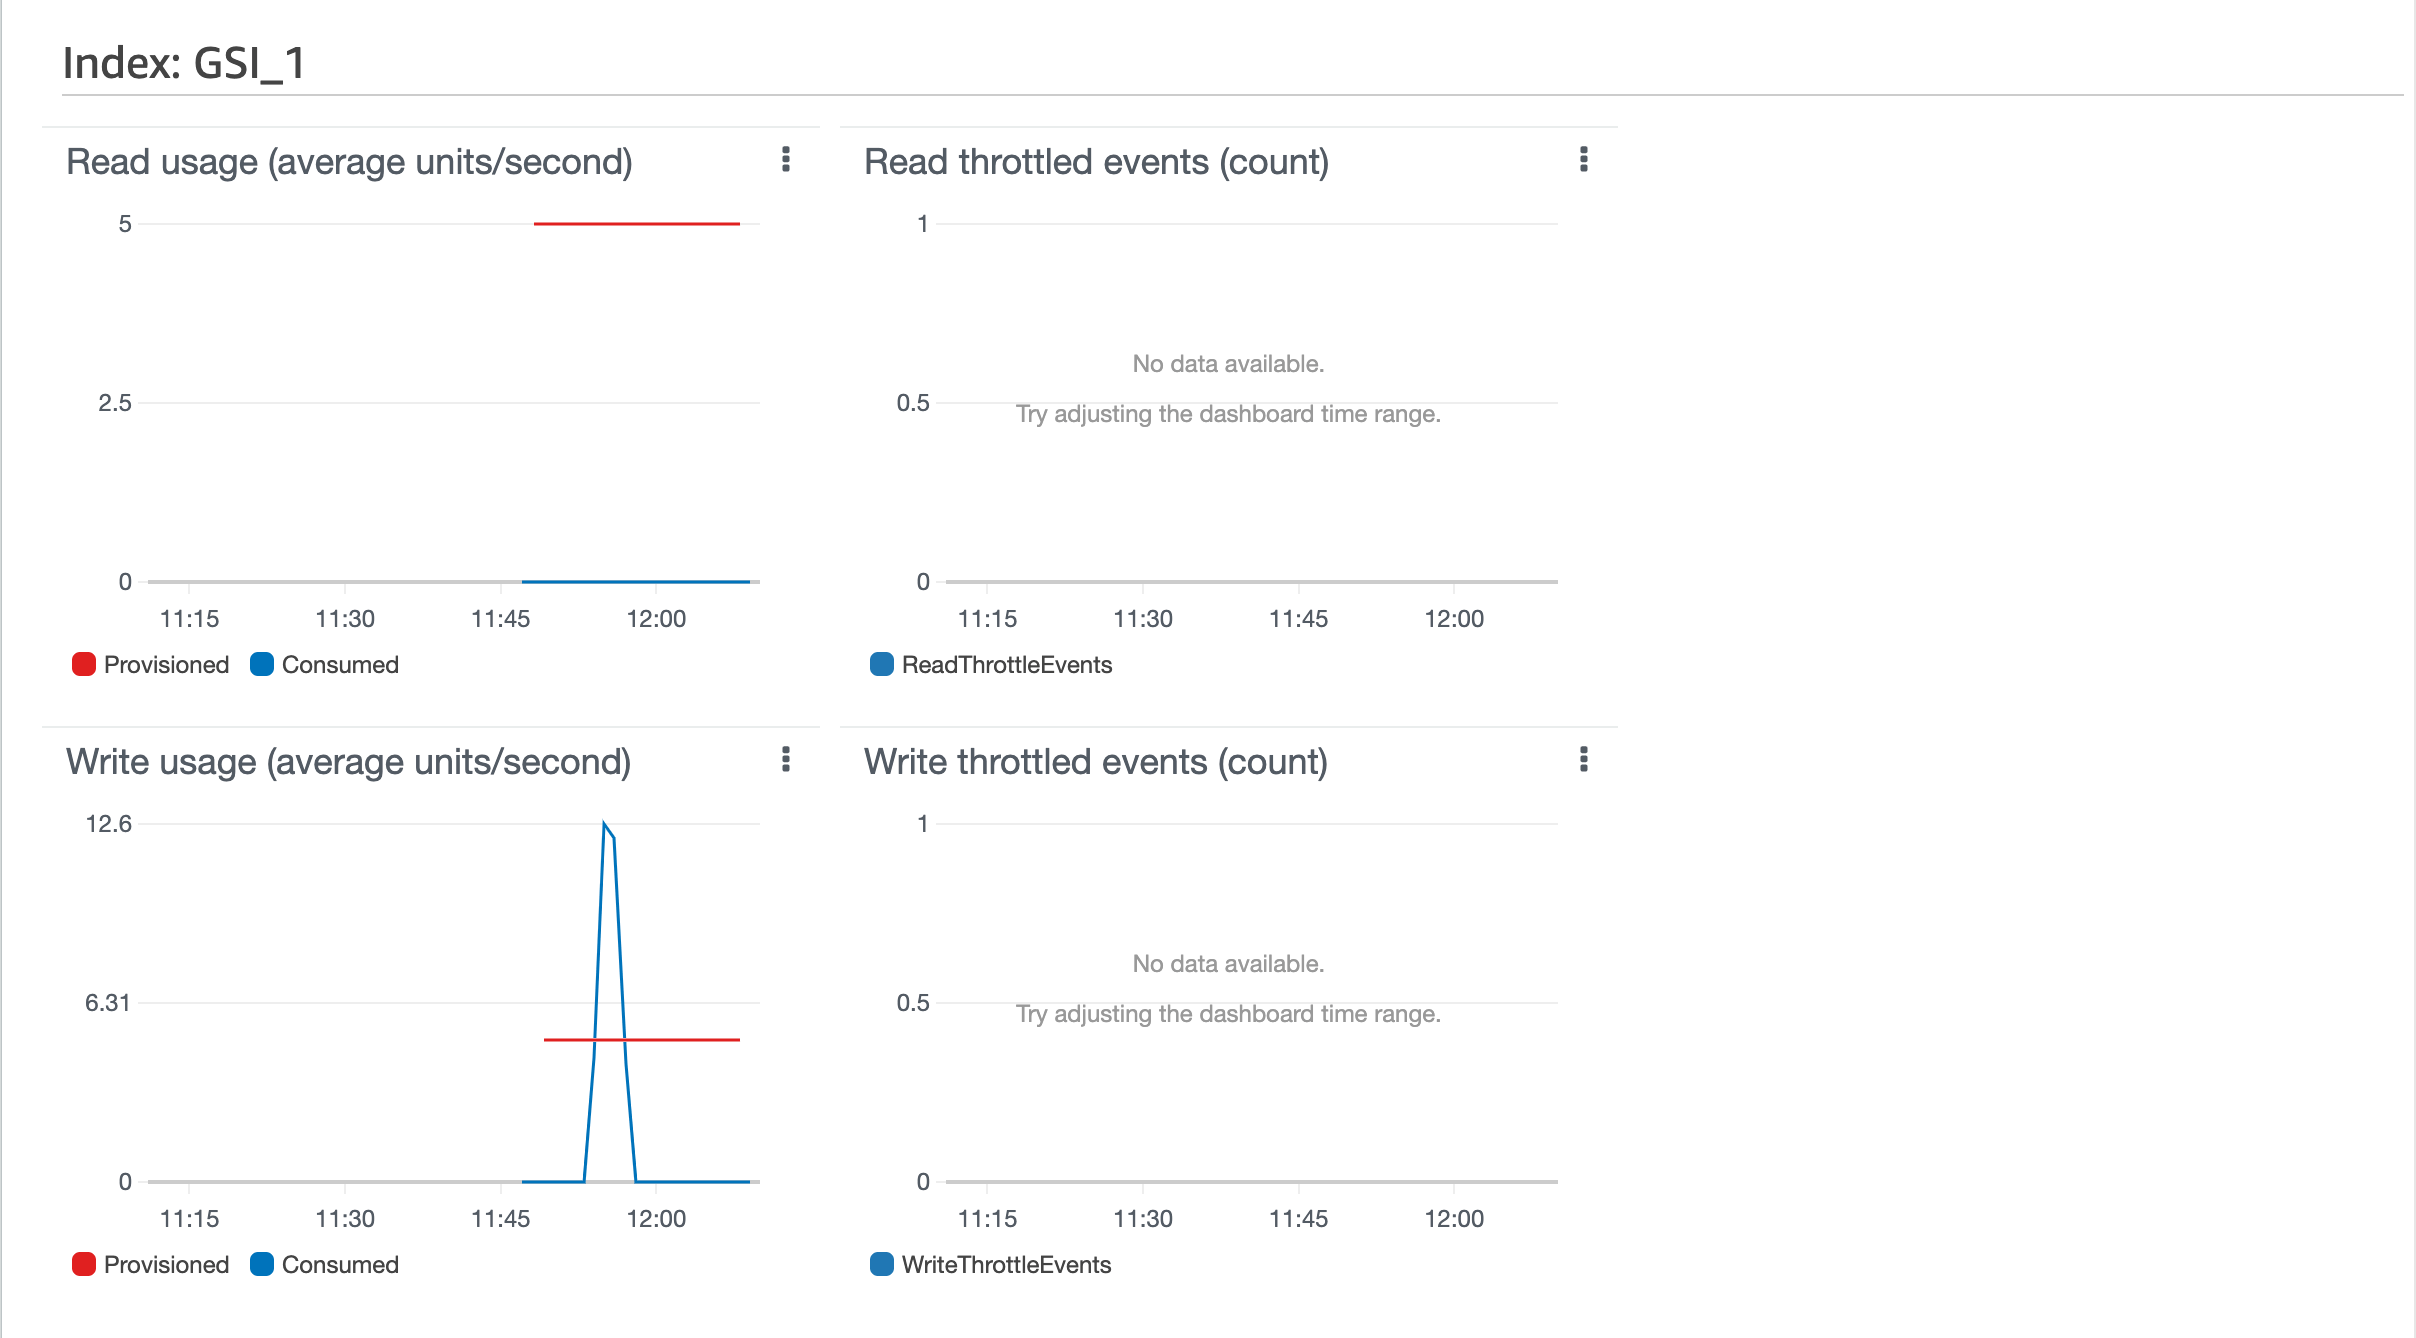
You might be wondering: Why are there throttling events on the table but not on the global secondary index? The reason is a base table receives the writes immediately and consumes write capacity doing so, whereas a global secondary index’s capacity is consumed asynchronously some time after the initial write to the base table succeeds. In order for this system to work inside the DynamoDB service, there is a buffer between a given base DynamoDB table and a global secondary index (GSI). A base table will quickly surface a throttle if capacity is exhausted, whereas only an imbalance over an extended period of time on a GSI will cause the buffer to fill, thereby generating a throttle. In short, a GSI is more forgiving in the case of an imbalanced access pattern.
Continue this exercise to see what happens when you add more write capacity to the base DynamoDB table.