Step 7 - Create a new table with a low-capacity global secondary index
Now, create a new table with different capacity units. The new table’s global secondary index has only 1 write capacity unit (WCU) and 1 read capacity unit (RCU).
To create the new table, run the following AWS CLI command.
aws dynamodb create-table --table-name logfile_gsi_low \
--attribute-definitions AttributeName=PK,AttributeType=S AttributeName=GSI_1_PK,AttributeType=S \
--key-schema AttributeName=PK,KeyType=HASH \
--provisioned-throughput ReadCapacityUnits=1000,WriteCapacityUnits=1000 \
--tags Key=workshop-design-patterns,Value=targeted-for-cleanup \
--global-secondary-indexes "IndexName=GSI_1,\
KeySchema=[{AttributeName=GSI_1_PK,KeyType=HASH}],\
Projection={ProjectionType=INCLUDE,NonKeyAttributes=['bytessent']},\
ProvisionedThroughput={ReadCapacityUnits=1,WriteCapacityUnits=1}"
Run the following AWS CLI command to wait until the table becomes ACTIVE:
aws dynamodb wait table-exists --table-name logfile_gsi_low
The initial command creates a new table and one global secondary index with the following definition:
Table: logfile_gsi_low
- Key schema: HASH (partition key)
- Table read capacity units (RCUs) = 1000
- Table write capacity units (WCUs) = 1000
- Global secondary index:
- GSI_1 (1 RCU, 1 WCU) - Allows for querying by host IP address
| Attribute Name (Type) | Special Attribute? | Attribute Use Case | Sample Attribute Value |
|---|---|---|---|
| PK (STRING) | Partition key | Holds the request ID for the access log | request#104009 |
| GSI_1_PK (STRING) | GSI 1 partition key | The host for the request, an IPv4 address | host#66.249.67.3 |
Let’s populate this table with a large dataset. You will use a multi-threaded version of the Python load script to simulate more writes per second to the DynamoDB table. This will create contention for provisioned capacity to simulate a surge of traffic on an under-provisioned table.
python load_logfile_parallel.py logfile_gsi_low
After a few minutes, the execution of this script will be throttled and show an error message similar to the following error. This indicates you should increase the provisioned capacity of the DynamoDB table, or enable DynamoDB auto scaling if you have not already (read more about DynamoDB auto scaling in the AWS documentation ).
ProvisionedThroughputExceededException: An error occurred (ProvisionedThroughputExceededException) when calling the BatchWriteItem operation (reached max retries: 9): The level of configured provisioned throughput for one or more global secondary indexes of the table was exceeded. Consider increasing your provisioning level for the under-provisioned global secondary indexes with the UpdateTable API
You can pause the operation by typing Ctrl+Z (Ctrl+C if you are Mac user).
This new table has more RCUs (1,000) and WCUs (1,000), but you still got an error and the load time increased.
ProvisionedThroughputExceededException was returned by DynamoDB with an exception message suggesting the provisioned capacity of the GSI be increased. This is a telling error, and one that needs to be acted upon. In short, if you want 100% of the writes on the DynamoDB base table to be copied into the GSI, then the GSI should be provisioned with 100% (the same amount) of the capacity on the base table, which should be 1,000 WCU in this example. Simply put, the GSI was under-provisioned.
Review the table in the AWS Console
Let’s review the Amazon CloudWatch metrics for this test in the AWS management console for Amazon DynamoDB. We will need to see which metrics were emitted to CloudWatch during this bout of write throttling.
Open the AWS console, or switch to your browser tab with the AWS console, to view the metrics for the logfile_gsi_low table. These are found under the DynamoDB section of the AWS management console in the tables view. If you don’t see the table, remember to click the refresh button on the top right of the DynamoDB console.
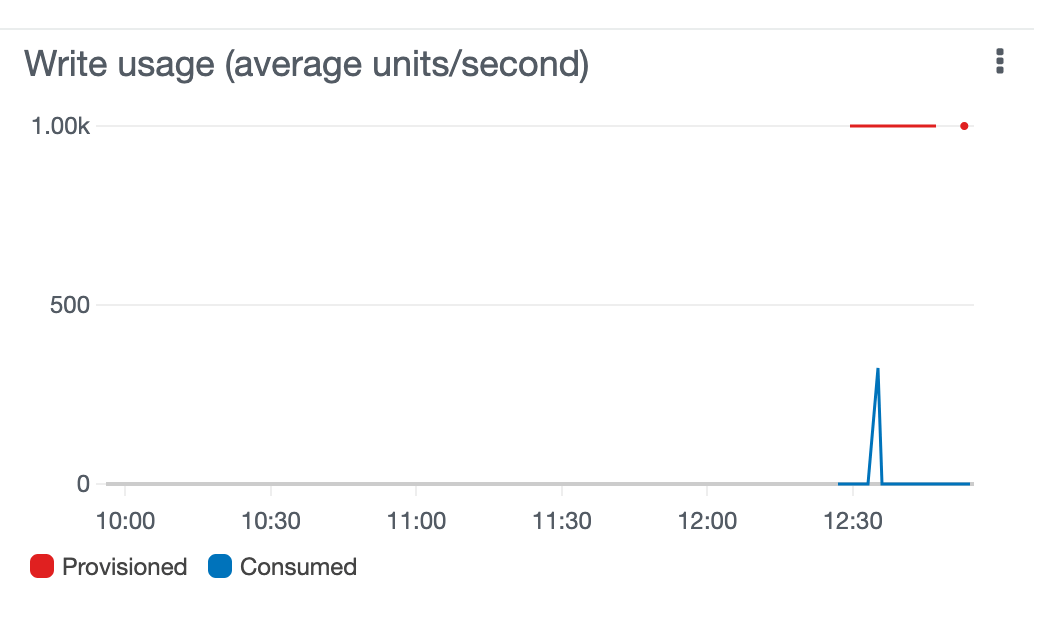
The following image shows the write capacity metric for the logfile_gsi_low table. Note that the consumed writes (the blue line) were lower than the provisioned writes (red line) for the table during the test. This tells us the base table had sufficient write capacity for the surge of requests.
It may take a few minutes for the provisioned capacity (red line) to show up in the graphs. The provisioned capacity metrics are synthetic and there can be delays of five to ten minutes until they show a change.
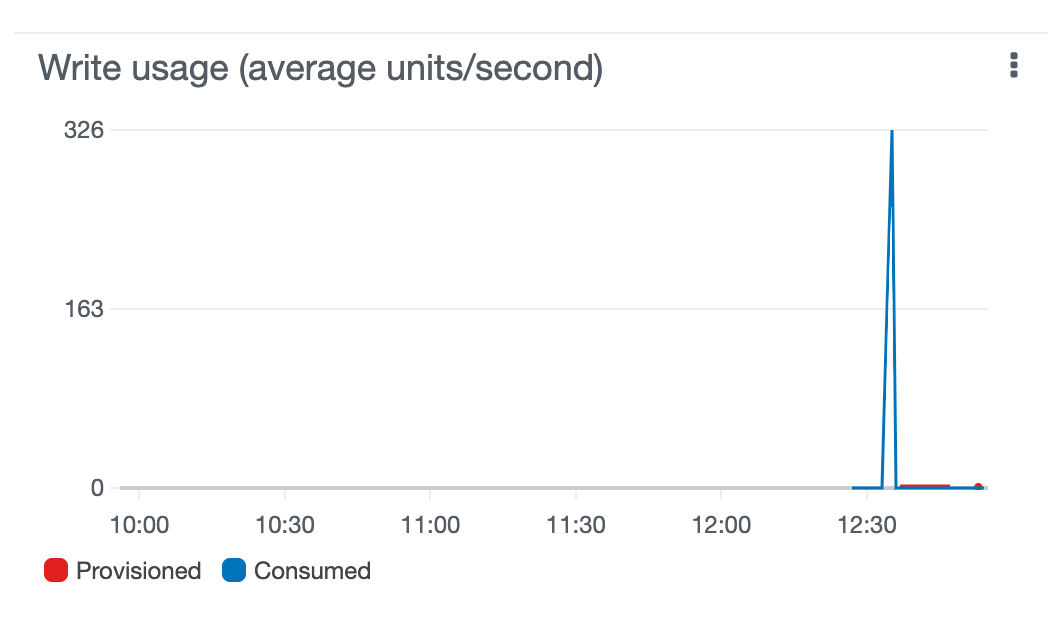
The following image shows the write capacity metric for the global secondary index. Note that the consumed writes (the blue line) were higher than the provisioned writes (red line) for the global secondary index during the test. This tells us the GSI was woefully under-provisioned for the requests it received.
The following image shows the throttled write requests for the logfile_gsi_low table. Note that the table has throttled write requests, even though the base table was provisioned with sufficient WCUs. Each throttled API request on DynamoDB generates one datapoint for the ThrottledRequests metric. In this picture, about 20 API requests were throttled by DynamoDB. However, the table has a GSI and we do not yet know if it, or the base table was the source of the throttle. We must continue investigating. 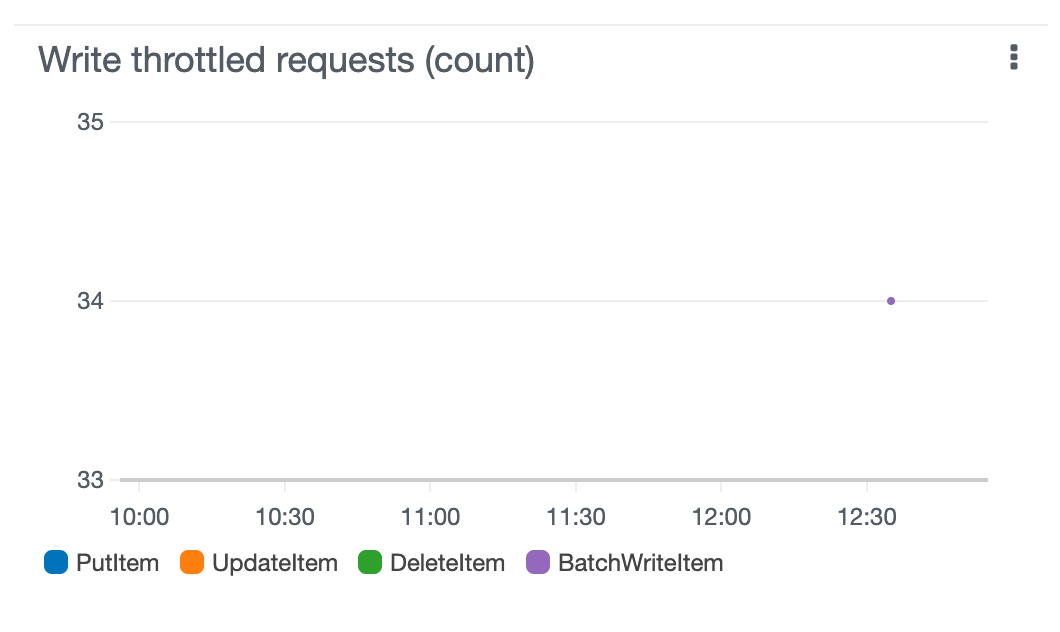
To identify the source of these throttled write requests, review the throttled write events metric. If the DynamoDB base table is the throttle source, it will have WriteThrottleEvents. However, if the GSI has insufficient write capacity, it will have WriteThrottleEvents.
When you review the throttle events for the GSI, you will see the source of our throttles! Only the GSI has ‘Throttled write events’, which means it is the source of throttling on the table, and the cause of the throttled Batch write requests.
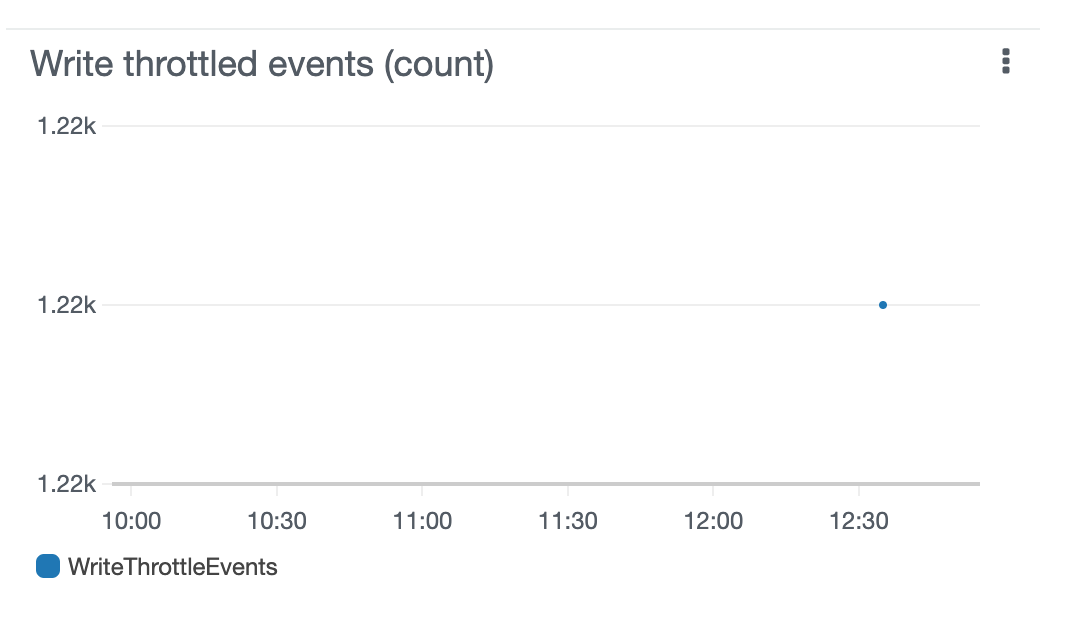
It may take some time for the write throttle events to appear on the GSI throttled write events graph. If you don’t immediately see metrics, re-run the command above to load data into DynamoDB and let it continue for several minutes so that many throttling events are created.
ProvisionedThroughputExceededException errors in the AWS SDKs, generate ThrottledRequests metrics in CloudWatch, and appear as ’throttled write requests’ on the base table in the AWS console. When GSI back pressure occurs, all writes to the DynamoDB table are rejected until space in the buffer between the DynamoDB base table and GSI opens up. Regardless of whether a new row is destined for a GSI, writes for a time will be rejected on the base table until space is available - DynamoDB does not have time to determine if a row to be written will be in the GSI or not. This is a troubling situation, but it’s an unavoidable constraint from DynamoDB because the service cannot create a buffer of unlimited size between your base table and GSI; there must be a limit to the number of items waiting to be copied from the base table into a GSI. In order to be aware of this behavior early, it’s important to monitor throttled requests and events on your DynamoDB table and GSI.
Review
Remember that a DynamoDB table is provisioned separately from a global secondary index. If you underprovision a global secondary index, it might start to apply back pressure on your tables in the form of throttles. Back pressure is problematic because it will cause all write requests to the base table to be rejected until the buffer between the base table and GSI has enough space for new data. Remember to monitor the CloudWatch metrics on both your tables and global secondary indexes, and set monitoring alarms based on your business requirements.